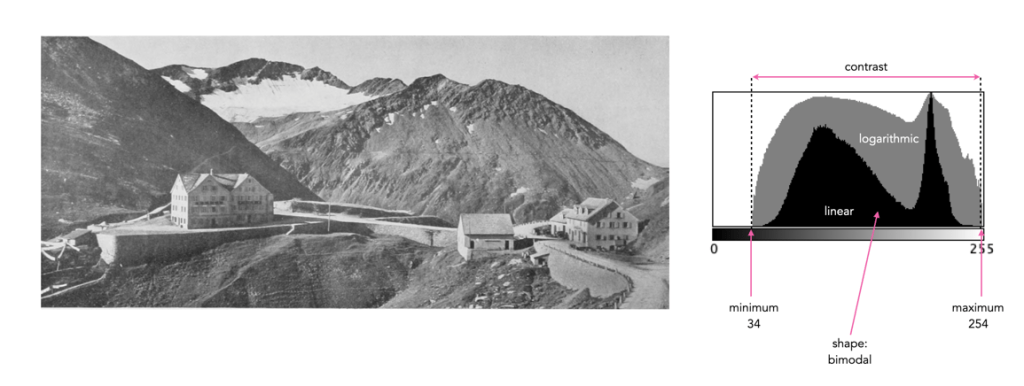
Sometimes a histogram is depicted logarithmically. A histogram will typically depict only large frequencies, i.e. histogram intensities with limited values will not be visualized. The logarithmic form helps to accentuate low frequency occurrences, making them readily apparent. In the example histogram shown below, intensity level 39 has a value of 9, which would not show up in a regular histogram given the scale, e.g. intensity 206 has a count of 9113.