The simplest data about an image it that contained within its histogram, or rather the distribution of pixel intensities. In an 8-bit grayscale image, this results in a 256-bin histogram which tells a story about how the pixels are distributed within the image. Most digital cameras also have some form of colour histogram which can be used to determine distribution of colours in an image. This lets the photographer determine whether the photograph is over- under- or correctly exposed. A correctly exposed photograph will have a fairly uniform histogram, whereas an under-exposed one has a bias towards darker tones, and an over-exposed one will have a bias towards brighter tones.
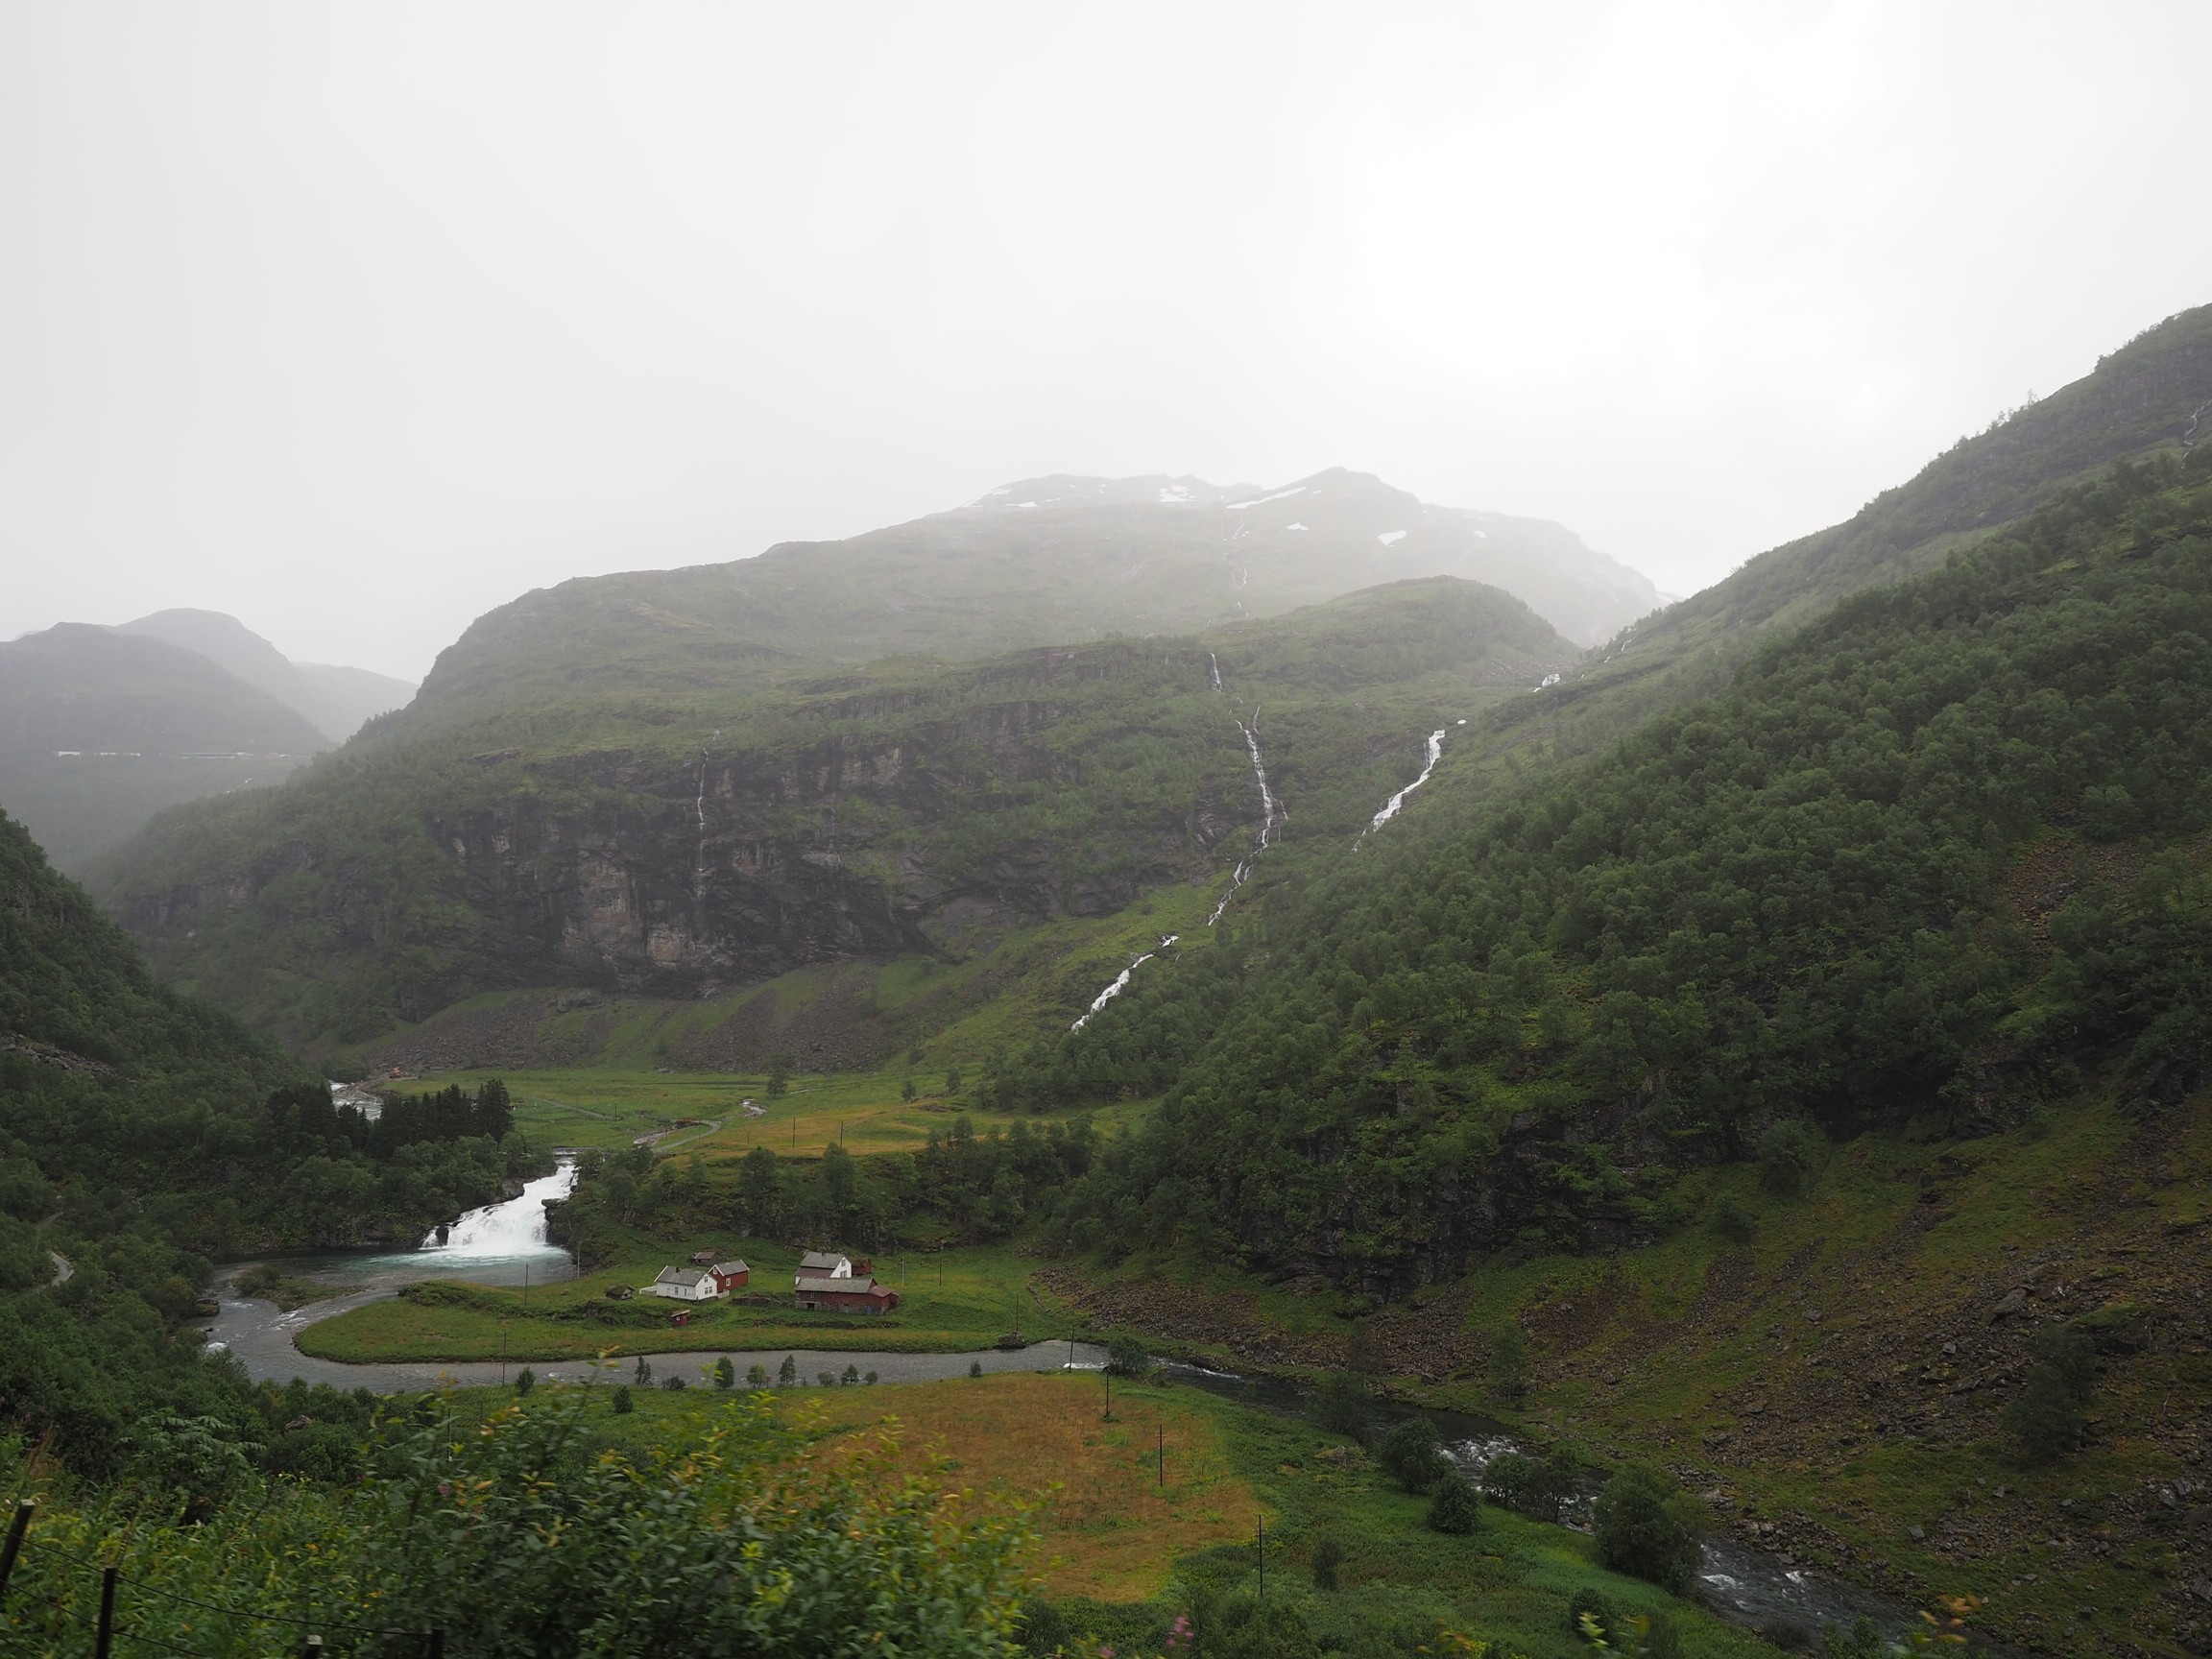
This by no means means that a histogram that has two distinct modes does not represent a good image. As long as the histogram is well distributed between the lower and upper limits of the colour space. Consider the image below:

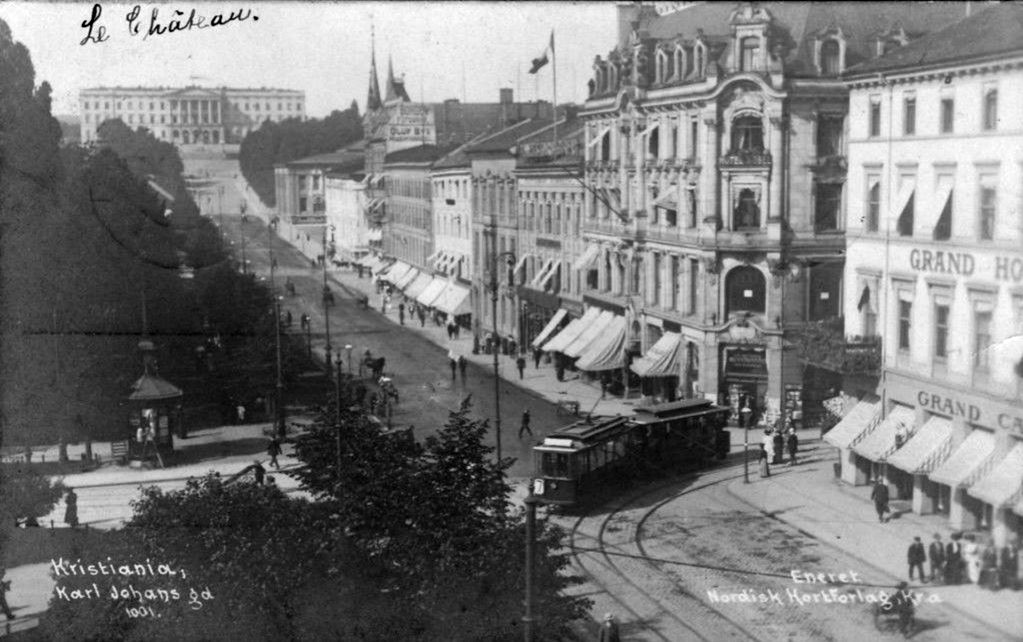
From an aesthetic perspective, this does not seem like a bad looking image. Its histogram somewhat collaborates this:

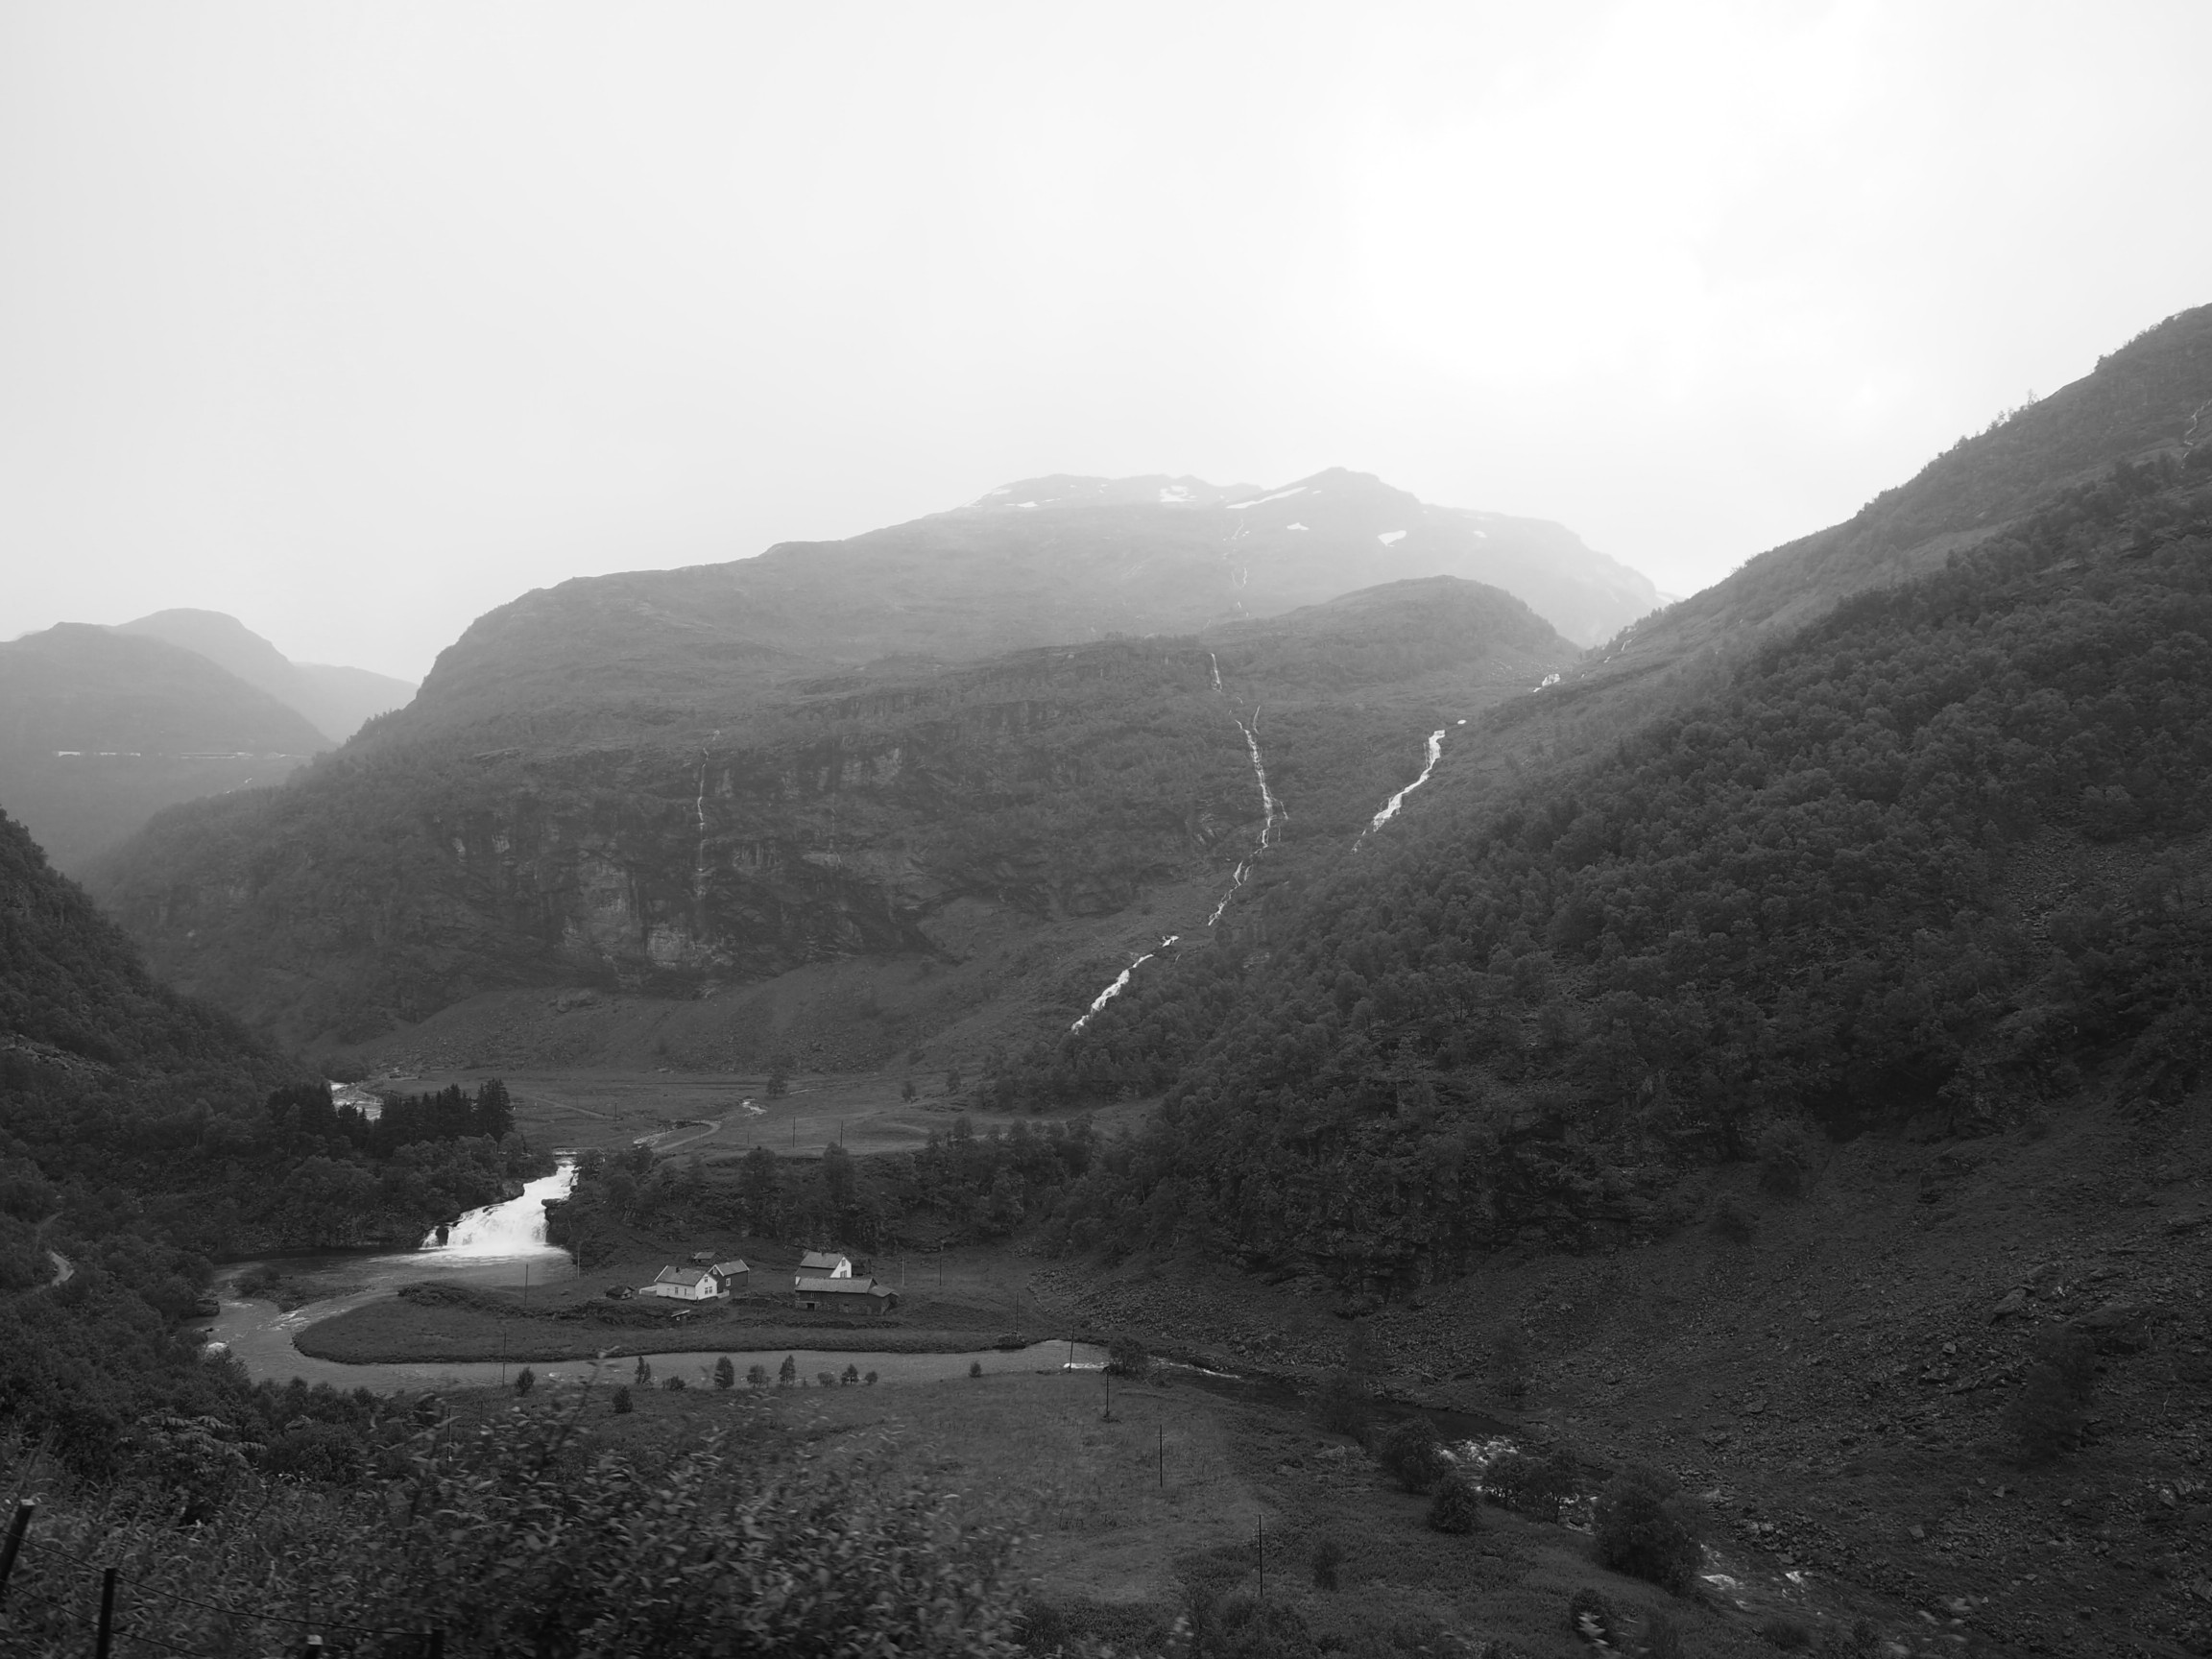
In fact there is limited scope for enhancement here. Application of contrast-stretching or histogram equalization will increase its aesthetic appeal marginally. One of the properties of an image that a histogram helps identify is contrast, or dynamic range. On the other end of the spectrum, consider this image which has a narrow dynamic range.

The histogram clearly shows the lack of range in the image.

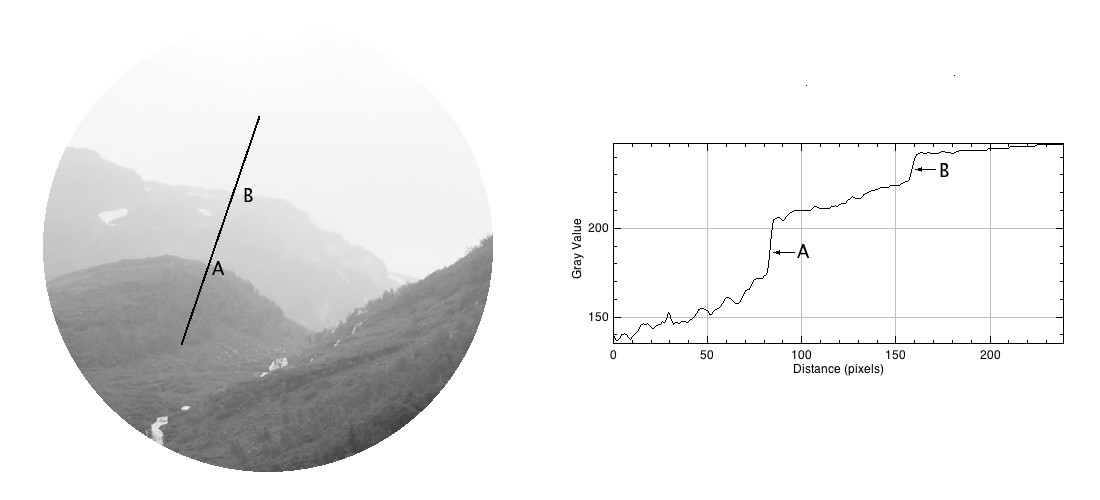
Stretching the histogram to either end of the spectrum increases the contrast of the image. The result is shown below.
It has a broader dynamic range, and a greater contrast of features within the image.