the image histogram (iii) – useful information

Some people think that the histogram is some sort of panacea for digital photography, a means of deciding whether an image is “perfect” enough. Others tend to disregard the statistical response it provides completely. This leads us to question what useful information is there in a histogram, and how we go about interpreting it.

A plethora of information

A histogram maps the brightness or intensity of every pixel in an image. But what does this information tell us? One of the main roles of a histogram is to provide information on the tonal distributions in an image. This is useful to help determine if there is something askew with the visual appearance of an image. Histograms can be viewed live/in-camera, for the purpose of determining whether or not an image has been corrected exposed, or used during post-processing to fix aesthetic inadequacies. Aesthetic deficiencies can occur during the acquisition process, or can be intrinsic to the image itself, e.g. faded vintage photographs. Examples of deficiencies include such things as blown highlights, or lack of contrast.

A histogram can tell us many differing things about how intensities are distributed throughout the image. Figure 1 shows an example of a colour image, photograph taken in Bergen, Norway, its associated grayscale image and histograms. The histogram spans the entire range of intensity values. Midtones comprise 66% of pixels in the image, with the majority tiered towards the lighter midtone values (the largest hump in the histogram). Shadow pixels comprise only 7% of the whole image, and are actually associated with shaded regions in the image. Highlights relate to regions like the white building on the left, and some of the clouds. There are very few pure white, the exception being the shopfront signs. Some of the major features in the histogram are indicated in the image.

Fig.1: A colour image and its histograms

There is no perfect histogram

Before we get into the nitty-gritty, there is one thing that should be made clear. Sometimes there are infographics on the internet that tout the myth of a “perfect” or “ideal” histogram. The reality is that such infographics are very misleading. There is no such thing as a perfect histogram. The notion of the ideal histogram is one that is shaped like a “bell”, but there is no reason why the distribution of intensities should be that even. Here is the usual description of an ideal image: “An ideal image has a histogram which has a centred hill type shape, with no obvious skew, and a form that is spread across the entire histogram (and without clipping)”.

Fig.2: A bell-shaped curve

But a scene may be naturally darker or lighter rather than midtones found in a bell-shaped histogram. Photographs taken in the latter part of the day will be naturally darker, as will photographs of dark objects. Conversely, a photograph of a snowy scene will skew to the right. Consider the picture of the Toronto skyline taken at night shown in Figure 3. Obviously the histogram doesn’t come close to being “perfect”, but the majority of the scene is dark – not unusual for a dark scene, and hence the histogram is representative of this. In this case the low-key histogram is ideal.
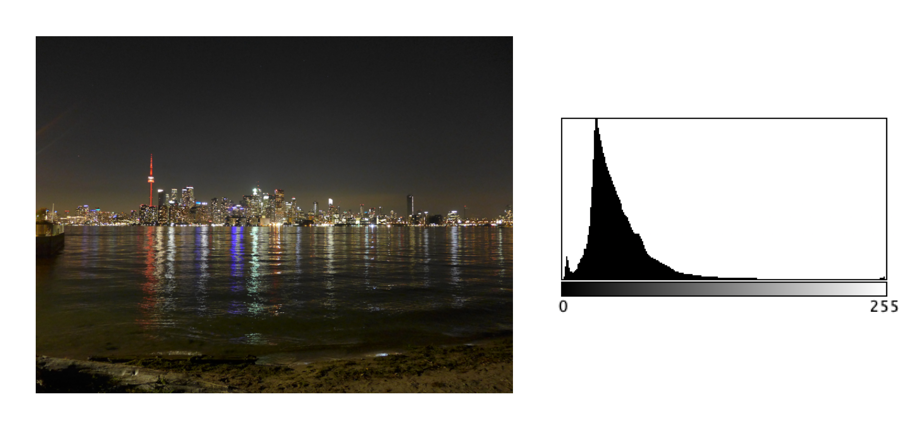
Fig.3: A dark image with a skewed histogram

Interpreting a histogram

Interpreting a histogram usually involves examining the size and uniformity of the distribution of intensities in the image. The first thing to do is to look at the overall curve of the histogram to get some idea about its shape characteristics. The curve visually communicates the number of pixels in any one particular intensity.

First, check for any noticeable peaks, dips, or plateaus. For example peaks generally indicate a large number of pixels of a certain intensity range within the image. Plateaus indicate a uniform distribution of intensities. Check to see if the histogram skewed to the left or right. A left-skewed histogram might indicate underexposure, the scene itself being dark (e.g. a night scene), or containing dark objects. A right-skewed histogram may indicate overexposure, or a scene full of white objects. A centred histogram may indicate a well-exposed image, because it is full of mid-tones. A small, uniform hill may indicate a lack of contrast.

Next look at the edges of the histogram. A histogram with peaks that are placed against either edge of the histogram may indicate some loss of information, a phenomena known as clipping. For example if clipping occurs on the right side, something known as highlight clipping, the image may be overexposed in some areas. This is a common occurrence in semi-bright overcast days, where the clouds can become blown-out. But of course this is relative to the scene content of the image. As well as shape, the histogram shows how pixels are groups into tonal regions, i.e. the highlights, shadows, and midtones.

Consider the example shown below in Figure 4. Some might interpret this as somewhat of an “ideal” histogram. Most of the pixels appear in the midtones region of the histogram, with no great amount of blacks below 17, nor whites above 211. This is a well-formed image, except that it lacks some contrast. Stretching the histogram over the entire range of 0-255 could help improve the contrast.

Fig.4: An ideal image with a central “hump” (but lacking some contrast)

Now consider a second example. This picture in Figure 5 is of a corner grocery store in Montreal and has a histogram with a multipeak shape. The three distinct features almost fit into the three tonal regions: the shadows (dark blue regions, and empty dark space to the right of the building), the midtones (e.g. the road), and the highlights (the light upper brick portion of the building). There is nothing intrinsically wrong with this histogram, as it accurately represents the scene in the image.

Fig.4: An ideal image with multiple peaks in the histogram

Remember, if the image looks okay from a visual perspective, don’t second-guess minor disturbances in the histogram.

Next: More on interpretation – histogram shapes.

the image histogram (ii) – grayscale vs colour

In terms of image processing there are two basic types of histogram: (i) colour, and (ii) intensity (or luminance/grayscale) histograms. Figure 1 shows a colour image (an aerial shot of Montreal), and its associated RGB and intensity histograms. Colour histograms are essentially RGB histograms, typically represented by three separate histograms, one for each of the components – Red, Green, and Blue. The three R,G,B histograms are sometimes shown in one mixed histogram with all three R,G,B, components overlaid with one another (sometimes including an intensity histogram).

Fig.1: Colour and grayscale histograms

Both RGB and intensity histograms contain the same basic information – the distribution of values. The difference lies in what the values represent. In an intensity histogram, the values represent the intensity values in a grayscale image (typically 0 to 255). In an RGB histogram, divided into individual R, G, B histograms, each colour channel is just a graph of the frequencies of each of the RGB component values of each pixel.

An example is shown in Figure 2. Here a single pixel is extracted from an image. The RGB triplet for the pixel is (230,154,182) i.e. it has a red value of 230, a green value of 154, and a blue value of 182. Each value is counted in its respective bin in the associated component histogram. So red value 230 is counted in the bin marked as “230” in the red histogram. The three R,G, B histograms are visually no different than an intensity histogram. The individual R, G, and B histograms do not represent distributions of colours, but merely distributions of components – for that you need a 3D histogram (see bottom).

Fig.2: How an RGB histogram works: From single RGB pixel to RGB component histograms

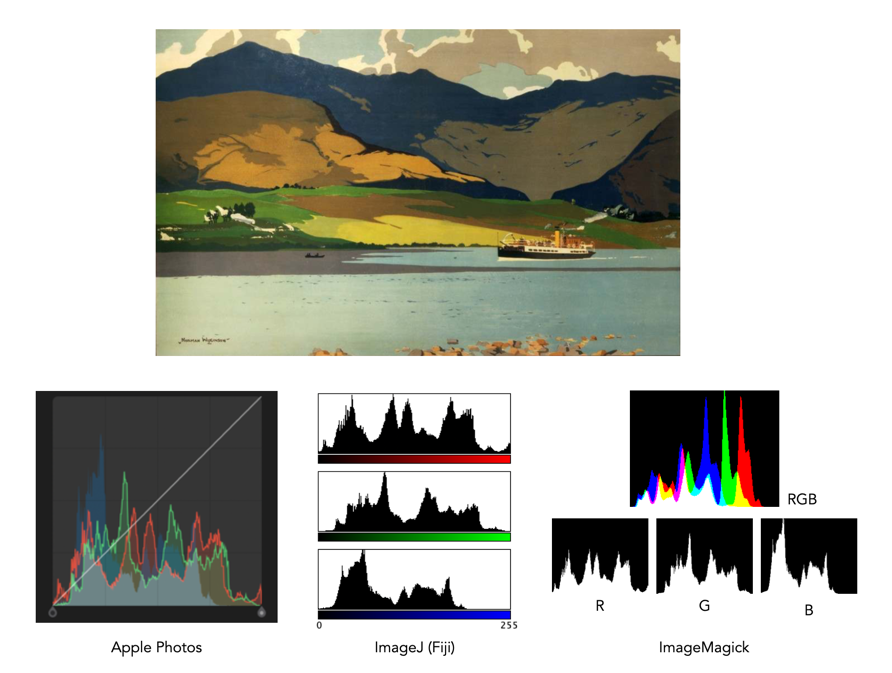
Applications portray colour histograms in many different forms. Figure 3 shows the RGB histograms from three differing applications: Apple Photos, ImageJ, and ImageMagick. Apple Photos provides the user with the option of showing the luminance histogram, the mixed RGB, or the individual R, G, B histograms. The combined histogram shows all the overlaid R, G, B histograms, and a gray region showing where all three overlap. ImageJ shows the three components in separate histograms, and ImageMagick provides an option for their combined or separate. Note that some histograms (ImageMagick) seem a little “compressed”, because of the chosen x-scale.

Fig.3: How RGB histograms are depicted in applications

One thing you may notice when comparing intensity and RGB histograms is that the intensity histogram is very similar to the green channel or the RGB image (see Figure 4). The human eye is more sensitive to green light than red or blue light. Typically the green intensity levels within an image are most representative of the brightness distribution of the colour image.

Fig.4: The RGB-green histogram verus intensity histogram

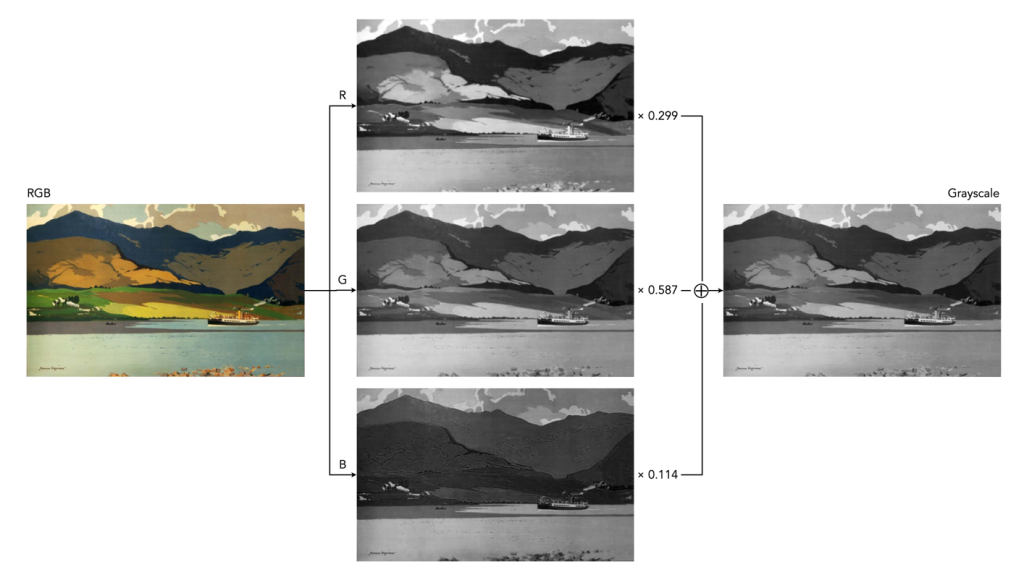
An intensity image is normally created from an RGB image by converting each pixel so that it represents a value based on a weighted average of the three colours at that pixel. This weighting assumes that green represents 59% of the perceived intensity, while the red and blue channels account for just 30% and 11%, respectively. Here is the actual formula used:

gray = 0.299R + 0.587G + 0.114B

Once you have a grayscale image, it can be used to derive an intensity histogram. Figure 5 illustrates how a grayscale image is created from an RGB image using this formula.

Fig.5: Deriving a grayscale image from an RGB image

Honestly there isn’t really that much useful data in RGB histograms, although they seem to be very common in image manipulation applications, and digital cameras. The problem lies with the notion of the RGB colour space. It is a space in which chrominance and luminance are coupled together, and as such it is difficult to manipulate any one of the channels without causing shifts in colour. Typically, applications that allow manipulation of the histogram do so by first converting the image to a decoupled colour space such as HSB (Hue-Saturation-Brightness), where the brightness can be manipulated independently of the colour information.

A Note on 3D RGB: Although it would be somewhat useful, there are very few applications that provide a 3D histogram, constructed from the R, G, and B information. One reason is that these 3D matrices could be very sparse. Instead of three 2D histograms, each with 256 pieces of information, there is now a 3D histogram with 2563 or 16,777,216 pieces of information. The other reason is that 3D histograms are hard to visualize.

the image histogram (i) – what is it?

An image is really just a collection of pixels of differing intensities, regardless of whether it is a grayscale (achromatic) or colour image. Exploring the pixels collectively helps provide an insight into the statistical attributes of an image. One way of doing this is by means of a histogram, which represents statistical information in a visual format. Using a histogram it is easy to determine whether there are issues with an image, such as over-exposure. In fact histograms are so useful that most digital cameras offer some form of real-time histogram in order to prevent poorly exposed photographs. Histograms can also be used in post-processing situations to improve the aesthetic appeal of an image.

Fig.1: A colour image with its intensity histogram overlaid.

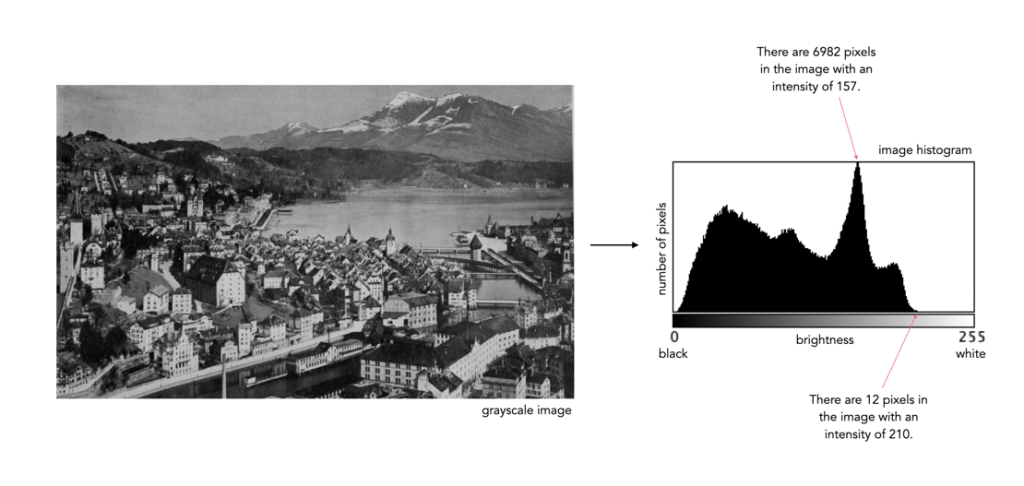
A histogram is simply a frequency distribution, represented in the form of a graph. An image histogram, sometimes called an intensity histogram, describes the frequency of intensity (brightness) values that occur in an image. Sometimes as in Figure 1, the histogram is represented as a bar graph, while other times it appears as a line graph. The graph typically has “brightness” on the horizontal axis, and “number of pixels” on the vertical axis. The “brightness” scale describes a series of values in a linear scale from 0, which represents black, to some value N, which represents white.

Fig.2: A grayscale image and its histogram.

A image histogram, H, contains N bins, with each bin containing a value representing the number of times an intensity value occurs in an image. So a histogram for a typical 8-bit grayscale image with 256 gray levels would have N=256 bins. Each bin in the histogram, H[i] represents the number of pixels in the image with intensity i. Therefore H[0] is the number of pixels with intensity 0 (black), H[1] the number of pixels with intensity 1, and so forth until H[255] which is the number of pixels with the maximum intensity value, 255 (i.e. white).

A histogram can be used to explore the overall information in an image. It provides a visual characterization of the intensities, but does not confer any spatial information, i.e. how the pixels physically relate to one another in the image. This is normal because the main function of a histogram is to represent statistical information in a compact form. The frequency data can be used to calculate the minimum and maximum intensity values, the mean, and even the median.

This series will look at the various types of histograms, how they can be used to produce better pictures, and how they can be manipulated to improve the aesthetics of an image.