If you do a search for “German Pentax” you will likely come across a reference to a German camera. Of course the name brand Pentax is most often associated with Japan’s Asahi Optical, but it wasn’t always the case. The name Pentax started life behind the Iron Curtain at VEB Zeiss Ikon Dresden. Zeiss Ikon was one of the photographic companies formed in East Germany after the division of Germany into East and West.
Zeiss Ikon Pentax
In 1954 Zeiss Ikon, based in Dresden, began work on a new 35mm camera. It was designed to use the new Zeiss 50mm f/2.8 lens, but was quite radical from a design perspective, looking more like a 120 film camera of the period. There only seem to be prototypes of this camera, and if you want to learn more you can check out the post on Marco Kroger’s website zeissikonveb.de. He says the first version of the camera was intended to be a 6×4.5 120-film camera, with the film loaded in removable cassettes. The page includes some interesting technical drawings of the camera.
But where did the name Pentax come from? Well due to the division of a number of German camera companies, there were some issues with product naming, mostly related to trademark infringement. As East German companies wanted to sell their products in the West, they often had to come up with new names. For example the name Contax was already being used by the West German Contax company. To circumvent this, East German companies often created portmanteau words by blending two words. For example, Pentacon was derived from “PENTAprism” and “CONtax”. Therefore it is thought that the registered trademark Pentax was derived from PENaprism ConTAX.
Because Zeiss Ikon had a name but no camera, it sold the name to Asahi in 1954 who attached it to their first Pentaprism SLR in 1957 – the Asahi Pentax.
In the days of film cameras, every company had it’s own way of “naming” cameras and lenses. This made it very easy to identify a lens. Asahi Pentax had the ubiquitous Takumar (TA-KOO-MA) name associated with its 35mm SLR and 6×7 lenses. The name would adorn the lenses from the period of the Asahiflex cameras with their M37 mount, through the M42 mount until 1975 when the switch to K-mount came with a change to the lens branding.
Asahi was founded by in 1919 by Kumao Kajiwara as Asahi Optical Joint Stock Co. Asahi began making film projection lenses in 1923, and by the early 1930s was producing camera lenses for the likes of future companies Minolta (1932), and Konica (1933). In 1937 with the installation of a military government in Japan, Asahi’s operations came under government control. By this time Kajiwara had passed away (it is not clear exactly when), and the business passed to his nephew Saburo Matsumoto (possibly 1936?). It was Matsumoto who had the vision of producing a compact reflex camera. In 1938 he bought a small factory in Tokyo and renamed it as Asahi Optical Co. Ltd.
It seems as though the lens series was named in honour of one of the founders brother, Takuma Kajiwara. There might have been the analogy that photography was a means of painting with light, and lenses were like an artists brushes. On a side note, the name Takuma in Japanese is an amalgam of “taku” meaning “expand, open, support”, and “ma” meaning “real, genuine”.
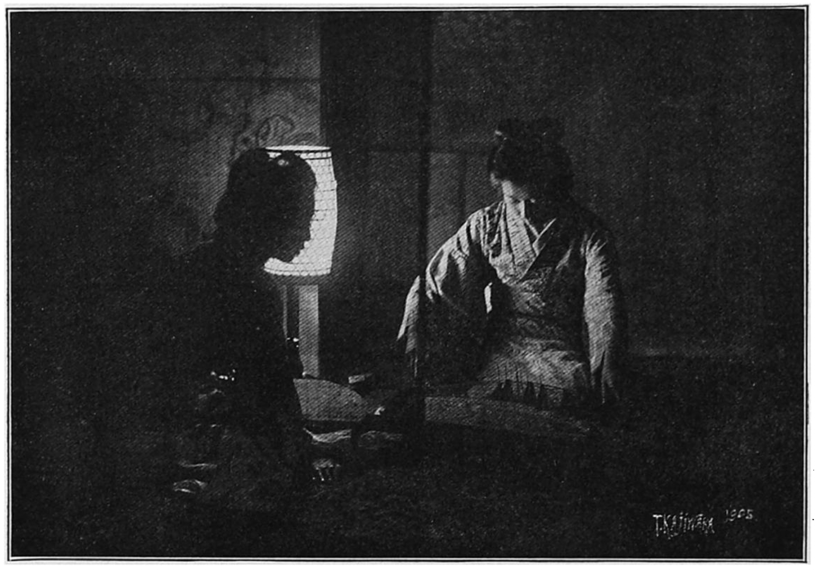
A photograph by Takuma titled “Domestic Life in Japan”, published in the September 1905 issue of Brush and Pencil (“St. Louis Art at the Portland Exposition” XVI(3), p.75).
Takuma Kajiwara (1876-1960) was a Japanese-American photographic artist and painter who specialize d in portraits. Born in Kyushi, Japan he was the third of five brothers in a Samurai family. Emigrating to America at the age of 17, he settled in Seattle, and became a photographer. He later moved to St.Louis and opened a portrait studio, turning from photography to painting. In 1935 he moved to New York. In 1951 he won the gold medal of honour for oils from the Allied Artists of America for his expressionist painting of the Garden of Eden titled “It All Happened in Six Days”. Takuma himself had an interest in cameras, patenting a camera in 1915 (Patent No. US1193392).
Note that it is really hard to determine the exact story due to the lack of accessible information.
I have worked on image processing algorithms on and off for nearly 30 years. I really don’t have much to show for it because in reality I found it was hard to build on algorithms that already existed. What am I talking about, don’t all techniques evolve? Well, yes and no. What I have learned over the years is that although it is possible to create unique, automated algorithms to process images, in most cases it is very hard to make those algorithms generic, i.e. apply the algorithm to all images, and get aesthetically pleasing results. And I am talking about image processing here, i.e. improving or changing the aesthetic appeal of images, not image analysis, whereby the information in an image is extracted in some manner – there are some good algorithms out there, especially in machine vision, but predominantly for tasks that involve repetition in controlled environments, such as food production/processing lines.
The number one thing to understand about the aesthetics of an image is that it is completely subjective. In fact image processing would be better termed image aesthetics, or aesthetic processing. Developing algorithms for sharpening an image is all good and well, but it has to actually make a difference to an image from the perspective of human perception. Take unsharp masking for example – it is the classic means of applying sharpening to an image. I have worked on enhanced algorithms for sharpening, involving morphological shapes that can be tailored to the detail in an image, and while they work better, for the average user, there may not be any perceivable difference. This is especially true of images obtained using modern sharp optics.
How does an algorithm perceive this image? How does an algorithm know exactly what needs sharpening? Does an algorithm understand the aesthetics underlying the use of Bokeh in this image?
Part of the process of developing these algorithms is understanding the art of photography, and how simple things like lenses, and how various methods of taking a photo effect the outcome. If you ignore all those and just deal with the mathematical side of things, you will never develop a worthy algorithm. Or possibly you will, but it will be too complicated for a user to understand, let alone use. As for algorithms that supposedly quantify aesthetics in some manner – they will never be able to aesthetically interpret an image in the same way as a human.
Finally, improving the aesthetic appeal of an image can never be completely given over to an automated process, although the algorithms provided in many apps these days are good. Aesthetic manipulation is still a very fluid, dynamic, subjective process accomplished best through the use of tools in an app, making subtle changes until you are satisfied with the outcome. The problem with many academically-motivated algorithms is that they are driven more from a mathematical stance, rather than one based on aesthetics.
When it comes to megapixels, the bottom line might be how an image ends up being used. If viewed on a digital device, be it an ultra-resolution monitor or TV, there are limits to what you can see. To view an image on an 8K TV at full resolution, we would need a 33MP image. However any device smaller than this will happily work with a 24MP image, and still not display all the pixels. Printing is however another matter all together.
The standard for quality in printing is 300dpi, or 300 dots-per-inch. If we equate a pixel to a dot, then we can work out the maximum size an image can be printed. 300 dpi is generally the “standard”, because that is the resolution most commonly used. To put this into perspective, at 300dpi, or 300 dots per 25.4mm, each pixel printed on a medium would be 0.085mm, or about as thick as 105 GSM weight paper. That means a dot area of roughly 0.007mm². For example a 24MP image containing 6000×4000 pixels can be printed to a maximum size of 13.3×20 inches (33.8×50.8cm) at 300dpi. The print sizes for a number of different sized images printed using 300dpi are shown in Figure 1.
Fig.1: Maximum printing sizes for various image sizes at 300dpi
The thing is that you may not even need 300dpi? At 300dpi the minimum viewing distance is theoretically 11.46”, whereas dropping it down to 180dpi means the viewing distance increases to 19.1” (but the printed size of an image can increase). In the previous post we discussed visual acuity in terms of the math behind it. Knowing that a print will be viewed from a minimum of 30” away allows us to determine that the optimal DPI required is 115. Now if we have a large panoramic print, say 80″ wide, printed at 300dpi, then the calculated minimum viewing distance is ca. 12″ – but it is impossible to view the entire print being only one foot away from it. So how do we calculate the optimal viewing distance, and then use this to calculate the actual number of DPI required?
The amount of megapixels required of a print can be guided in part by the viewing distance, i.e. the distance from the centre of the print to the eyes of the viewer. The golden standard for calculating the optimal viewing distance involves the following process:
Calculate the diagonal of the print size required.
Multiply the diagonal by 1.5 to calculate the minimum viewing distance
Multiply the diagonal by 2.0 to calculate the maximum viewing distance.
For example a print which is 20×30″ will have a diagonal of 36″, so the optimal viewing distance range from minimum to maximum is 54-72 inches (137-182cm). This means that we are no longer reliant on the use of 300dpi for printing. Now we can use the equations set out in the previous post to calculate the minimum DPI for a viewing distance. For the example above, the minimum DPI required is only 3438/54=64dpi. This would imply that the image size required to create the print is (20*64)×(30*64) = 2.5MP. Figure 2 shows a series of sample print sizes, viewing distances, and minimum DPI (calculated using dpi=3438/min_dist).
Fig.2: Viewing distances and minimum DPI for various common print sizes
Now printing at such a low resolution likely has more limitations than benefits, for example there is no guarantee that people will view the panorama from a set distance. So there likely is a lower bound to the practical amount of DPI required, probably around 180-200dpi because nobody wants to see pixels. For the 20×30″ print, boosting the DPI to 200 would only require a modest 24MP image, whereas a full 300dpi print would require a staggering 54MP image! Figure 3 simulates a 1×1″ square representing various DPI configurations as they might be seen on a print. Note that even at 120dpi the pixels are visible – the lower the DPI, the greater the chance of “blocky” features when view up close.
Fig.3: Various DPI as printed in a 1×1″ square
Are the viewing distances realistic? As an example consider the viewing of a 36×12″ panorama. The diagonal for this print would be 37.9″, so the minimum distance would be calculated as 57 inches. This example is illustrated in Figure 4. Now if we work out the actual viewing angle this creates, it is 37.4°, which is pretty close to 40°. Why is this important? Well THX recommends that the “best seat-to-screen distance” (for a digital theatre) is one where the view angle approximates 40 degrees, and it’s probably not much different for pictures hanging on a wall. The minimum resolution for the panoramic print viewed at this distance would be about 60dpi, but it can be printed at 240dpi with an input image size of about 25MP.
Fig.4: An example of viewing a 36×12″ panorama
So choosing a printing resolution (DPI) is really a balance between: (i) the number of megapixels an image has, (ii) the size of the print required, and (iii) the distance a print will be viewed from. For example, a 24MP image printed at 300dpi will allow a maximum print size of 13.3×20 inches, which has an optimal viewing distance of 3 feet, however by reducing the DPI to 200, we get an increased print size of 20×30 inches, with an optimal viewing distance of 4.5 feet. It is an interplay of many differing factors, including where the print is to be viewed.
P.S. For small prints, such as 5×7 and 4×6, 300dpi is still the best.
P.P.S. For those who who can’t remember how to calculate the diagonal, it’s using the Pythagorean Theorem. So for a 20×30″ print, this would mean:
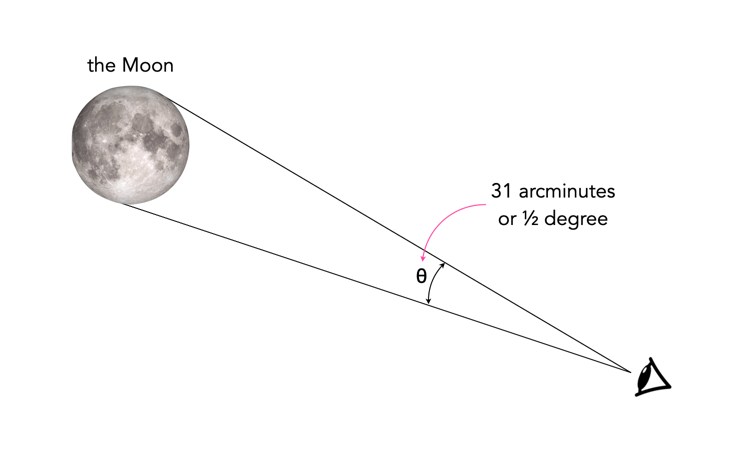
The number of megapixels required to print something, or view a television is ultimately determined by the human eye’s visual acuity, and the distance the object is viewed from. For someone with average vision (i.e. 20/20), their acuity would be defined as one arcminute, or 1/60th of a degree. For comparison, a full moon in the sky appears about 31 arcminutes (1/2 a degree) across (Figure 1).
Fig.1: Looking at the moon
Now generally, some descriptions skip from talking about arcminutes to describing how the distance between an observer and an object can calculated given the resolution of the object. For example, the distance (d, in inches) at which the eye reaches its resolution limit is often calculated using:
d = 3438 / h
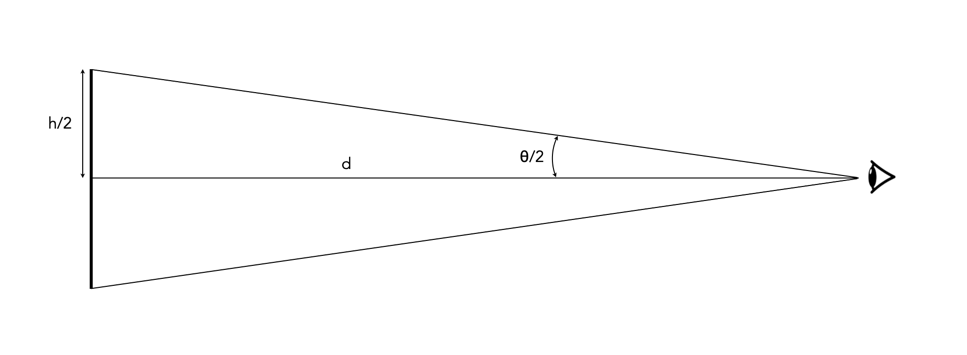
Where h, is the resolution, and can be ppi for screens, and dpi for prints. So if h=300, then d=11.46 inches. Now to calculate the optimal viewing distance involves a magic number – 3438. Where does this number come from? Few descriptions actually give any insights, but we can can start with some basic trigonometry. Consider the diagram in Figure 2, where h is the pixel pitch, d is the viewing distance, and θ is the angle of viewing.
Fig.2: Viewing an object
Now we can use the basic equation for calculating an angle, Theta (θ), given the length of the opposite and adjacent sides:
tan(θ) = opposite/adjacent
In order to apply this formula to the diagram in Figure 2, only θ/2 and h/2 are used.
tan(θ/2) = (h/2)/d
So now, we can solve for h.
d tan(θ/2) = h/2
2d⋅tan(θ/2) = h
Now if we use visual acuity as 1 arcminute, this is equivalent to 0.000290888 radians. Therefore:
h = 2d⋅tan(0.000290888/2)
  = 2d⋅0.000145444
So for d=24”, h= 0.00698 inches, or converted to mm (by multiplying by 25.4), h=0.177mm. To convert this into PPI/DPI, we simply take the inverse, so 1/0.00698 = 143 ppi/dpi. How do we turn this equation into one with the value 3438 in it? Well, given that the resolution can be calculated by taking the inverse, we can modify the previous equation:
So for a poster viewed at d=36″, the value of h=95dpi (which is the minimum). The viewing distance can be calculated by rearranging the equation above to:
d = 3438 / h
As an example, consider the Apple Watch Series 8, whose screen has a resolution of 326ppi. Performing the calculation gives d=3438/326 = 10.55”. So the watch should be held 10.55” from one’s face. For a poster printed at 300dpi, d=11.46”, and for a poster printed at 180dpi, d=19.1”. This is independent of the size of the poster, just printing resolution, and represents the minimum resolution at a particular distance – only if you move closer do you need a higher resolution. This is why billboards can be printed at a low resolution, even 1dpi, because when viewed from a distance it doesn’t really matter how low the resolution is.
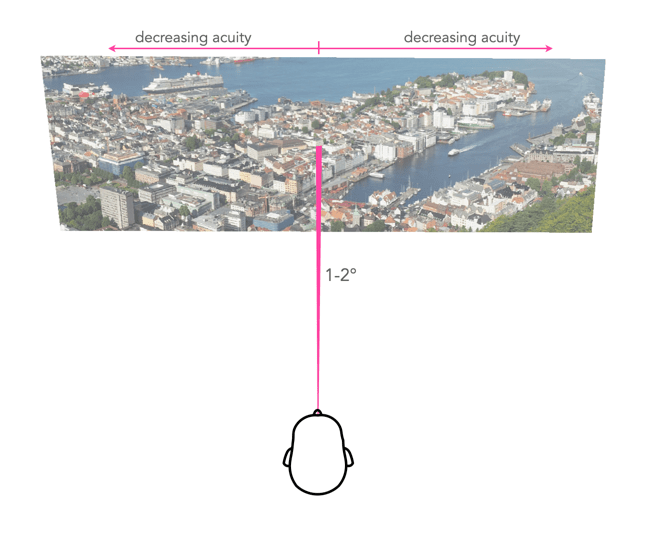
Note that there are many different variables at play when it comes to acuity. These calculations provide the simplest case scenario. For eyes outside the normal range, visual acuity is different, which will change the calculations (i.e. radians expressed in θ). The differing values for the arcminutes are: 0.75 (20/15), 1.5 (20/30), 2.0 (20/40), etc. There are also factors such as lighting, how eye prescriptions modify acuity, etc. to take into account. Finally, it should be added that these acuity calculations only take into account what is directly in front of our eyes, i.e. the narrow, sharp, vision provided by the foveola in the eye – all other parts of a scene, will have slightly less acuity moving out from this central point.
Fig.3: At 1-2° the foveola provides the greatest amount of acuity.
p.s. The same system can be used to calculate ideal monitor and TV sizes. For a 24″ viewing distance, the pixel pitch is h= 0.177mm. For a 4K (3840×2160) monitor, this would mean 3840*0.177=680mm, and 2160*0.177=382mm which after calculating the diagonal results in a 30.7″ monitor.
p.p.s. If using cm, the formula becomes: d = 8595 / h
This series of photographs and their associated histograms covers images with multipeak histograms, which come is many differing forms. None of these images is perfect, but they illustrate the fact that sometimes the perfect image is not possible given the constraints of the scene – shadows, bright skies and haze, sometimes they are just unavoidable.
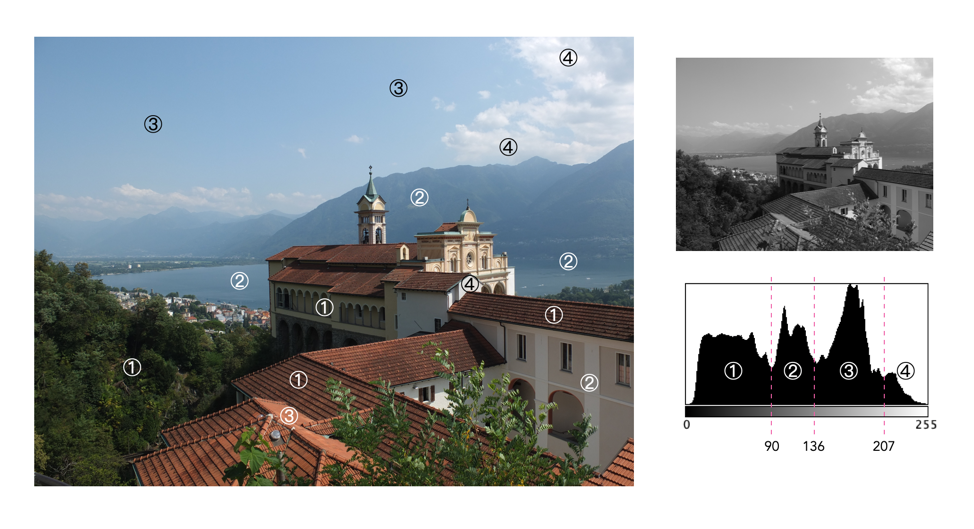
Histogram 1: A church and hazy hills
This photograph is taken in Locarno, Switzerland, with the church in the foreground the Madonna del Sasso. The histogram is of the multipeak variety, with few highlights. The left-most hump (①) represents the majority of the darker colours in the foreground, e.g. vegetation, and the parts of the building in shadow. The remaining two peaks are in the midtones, and represent various portions of the sky (③) as well as the lake, and hazed over mountains in the distance (②). Finally a small amount of highlights (④) represent the clouds and brightly lit portions of the church.
Fujifilm X10 (12MP): 7.1mm; f/5; 1/850
Histogram 2: Light hillside, dark forest
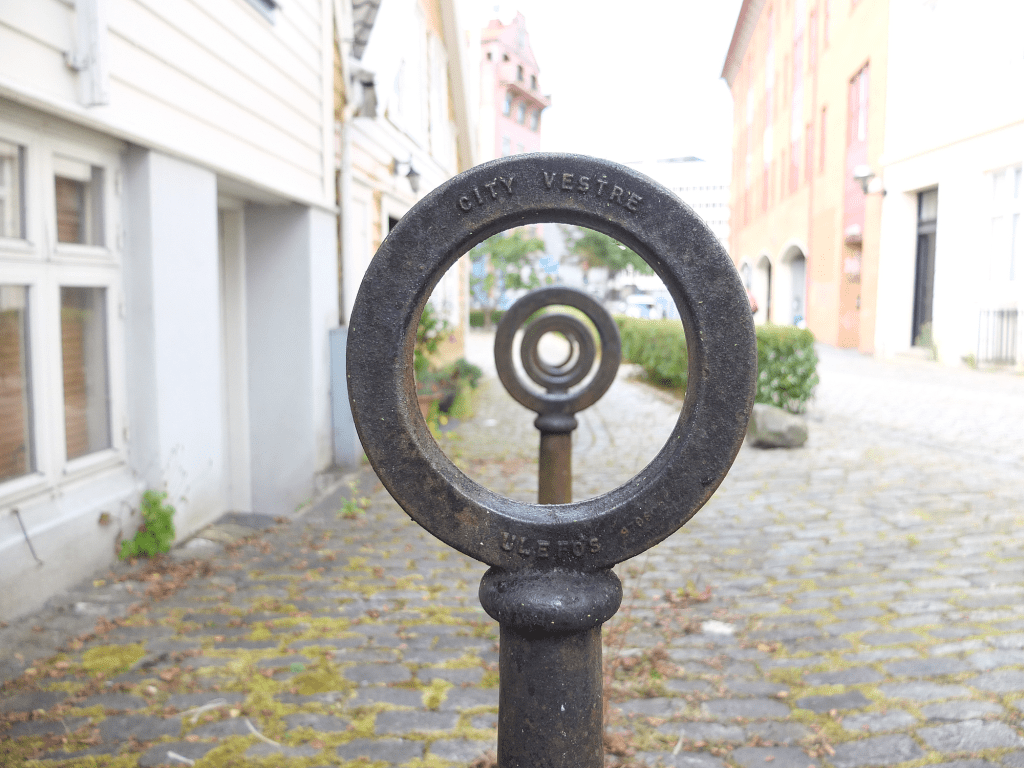
This is the Norwegian countryside, taken from the Bergen Line train. It is a well contrasted image, with only one core patch of shadow (①), behind the trees in the bottom left (there are a few other shadows in foreground objects such as the trees on the right). The midtones, ②, represent the rest of the landscape, with the lightest midtones and highlights composing the sky, ③.
Olympus E-M5II (12MP): 12mm; f/5; 1/400
Histogram 3: Gray station
This photograph is of the train station in Voss, Norway. It is an image with a good distribution of intensities, with four dominant peaks. The first peak, ①, is representative of the dark vegetation, and metal railings in the scene, overlapping somewhat into the mid-tones. The central peak (②) which is in the midtones, represents the light green pastures, and the large segments of asphalt on the station platform. The third peak, ③, which transitions into the highlights mostly deals with the light concreted areas. Finally there is a fourth peak, ④, which is really just a clipping artifact related to the small region of white sky.
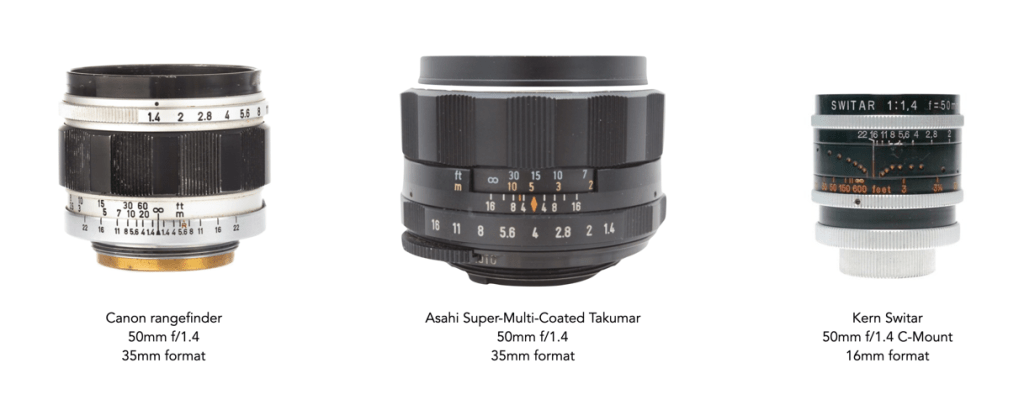
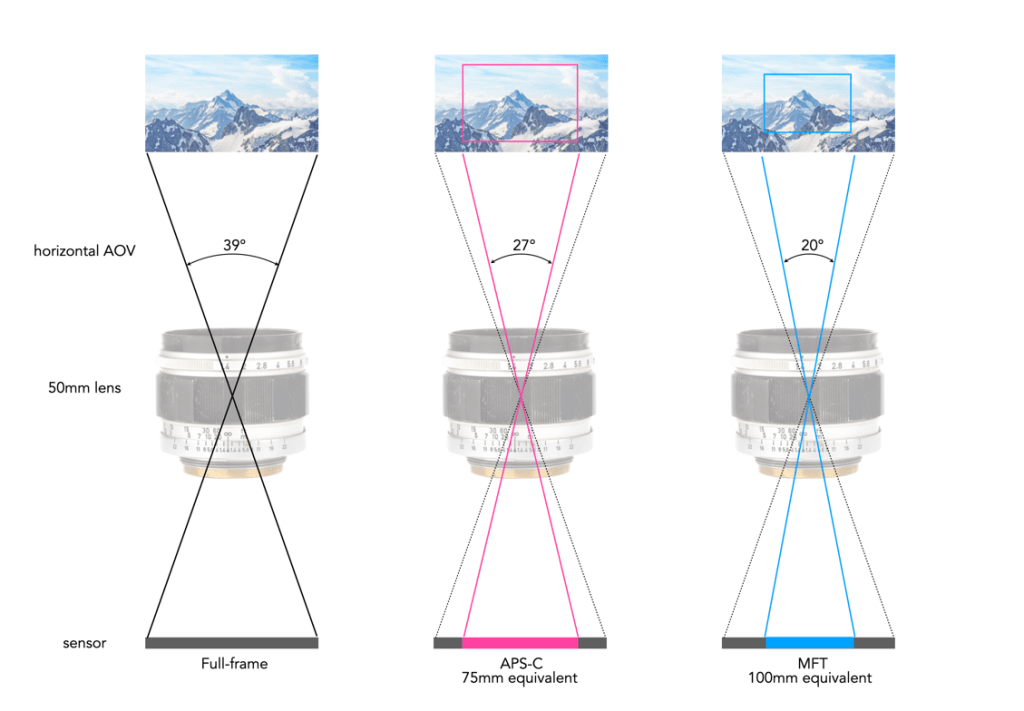
So a 50mm lens is a 50mm lens, is a 50mm lens, right? Well that’s not exactly true. The focal length of a 50mm lens is always 50mm, regardless of the system it is associated with. The focal length of a lens is independent of the camera system. So a 50mm lens on an SLR will have the same focal length as a 50mm lens on a DSLR, which is the same as one on an APS-C sensor, or a medium-format sensor. What is different is how they behave in terms of angle-of-view (AOV), with respect to a particular sensor size.
Fig.1: 50mm lenses all have the same focal length
Table 1 shows the behavioural differences of 50mm lenses on various systems. For example a 50mm lens from a 35mm rangefinder camera has a (horizontal) AOV of 39.6°, whereas the AOV of an APS-C camera, is 26.6°. This is because due to crop-factors, a 50mm lens on an APS-C sensor is equivalent to a 75mm on a full-frame camera (from an AOV perspective). To get a 39.6° equivalent AOV on an APS-C camera, you need roughly a 33mm lens – but the closest lens to this is a 35mm APS-C lens (35mm×1.5≈52mm).
System
AOV (diag)
AOV (hor)
Crop-factor
FF equiv.
16mm cine
14.5°
11.7°
×3.4
170mm
1″ sensor
18.2°
14.6°
×2.7
135mm
Micro-Four Thirds
24.5°
19.6°
×2.0
100mm
APS-C
31.7°
26.6°
×1.5
75mm
film SLR
46.8°
39.6°
×1.0
50mm
film rangefinder
46.8°
39.6°
×1.0
50mm
digital SLR (full-frame)
46.8°
39.6°
×1.0
50mm
digital Medium (44×33mm)
57.4°
47.5°
×0.8
40mm
6×7 (72×56mm)
84°
67.6°
×0.5
25mm
4×5”
117°
104°
×0.27
13.5mm
Table 1: Differences in 50mm lenses used on different systems
Note that because a 50mm lens on a Micro-Four-Thirds camera behaves like a 100mm FF lens, most manufacturers won’t sell a native 50mm MFT lens, opting instead for the 50mm FF equivalent – the 25mm. That’s because a 25mm MFT lens provides the “normal” angle-of-view, just like a 35mm APS-C lens, or a 100mm 6×7 lens. A vintage 50mm SLR lens used on an APS-C camera will behave like it was designed for APS-C, i.e. it will have a horizontal AOV of around 26.6°. The remaining 6.5° either side is just cut off because of the smaller sensor (as shown in Figure 2).
Fig.2: A visualization of what a 50mm lens sees on different sensors.
Invariably, all focal lengths are treated similarly. A 35mm is always 35mm, an 85mm is always 85mm. It’s just their behaviour, or rather their “view on life”, that changes.
There are some similarities between the camera and the human eye. Both have a lens, shutter, and light sensitive material. In the eye, the image is formed by a combination of the cornea, the aqueous humor, and the lens. The eye-lid is the shutter, and the retina is the light sensitive material. The other similarity is that both cameras and the eye control the image brightness by means of an iris diaphragm. In the eye the amount of light is involuntarily controlled by opening and closing the iris. A camera controls the light transmitted through the lens by means of the aperture diaphragm.
But comparing the eye and the camera with one another by stressing only the similarities in their construction has confused the understanding of photography, because it disregards the differences in their function. These differences make the eye superior to the cameras in some instances, and the camera superior to the eye in others.
Human vision is binocular and stereoscopic, that of the camera is monocular. This is why photographs lack the same “depth of field” that is seen through the human eyes. A camera sees a scene without depth, and a photograph appears flat.
The eye’s view of the world is subjective, viewing what the mind is interested in, has a wish to see, or is forced to see. The camera sees objectively, recording everything in its field of view. This is the reason so many pictures, are just pictures, full of superfluous subject matter.
The eye is sensitive to colour. Cameras and different lenses can see colour differently, and black-and-white photography sees colour as shades of gray (the transformation of colour to gray is also varied).
The eye does not normally perceive minor changes in the colour of light. Both film and sensors are sensitive to such small changes. This failure to detect changes in light colour manifests itself in what the eye considers “unnatural” colours.
The eye cannot “store” and combine bracketed images, or stay open for an amount of time and “add up light”. The dimmer the light, the less we see, no matter how long we look at a scene. Both film and sensors can do this – and this ability to accumulate light impressions makes images in low light possible – at levels where nothing can be seen by the human eye.
The eye is sensitive only to that part of the electromagnetic spectrum which is known as light. Photographic films and sensors can be sensitive to other types of radiation, e.g. infrared, ultraviolet, and x-rays.
The focal length of the eye is fixed, and as such is limited. A camera cam be equipped with lenses of almost any focal length.
The angle of view of the eyes is fixed, but lenses range in angle from a few degrees to 220°. The monocular AOV of an eye is (160° wide by 135° high), whereas binocular AOV is 200°×135° with an overlap of 120°.
Human vision functions to see 3D things in a rectilinear perspective. Most lenses produce a perspective that is cylindrical or spherical.
The focusing ability of the eye is severely limited with respect to close distances. Anything closer than about 25cm can usually only be seen indistinctly, with objects perceived less and less clearly the smaller they are, to the point where they become invisible to the naked eye. The camera, with the right accessories, has none of these restrictions.
To the human eye, everything appears sharp at the same time (actually an illusion caused by the ability of the eye to autofocus). A camera can produce images with any degree of unsharpness, or images in which a predetermined zone is rendered sharp, while everything else is out-of-focus.
The eye can adjust almost instantaneously to changes in illumination, by contracting and enlarging the iris as it views light and dark scenes respectively. The camera’s “iris”, its diaphragm, can only be adjusted for overall brightness. Therefore the contrast range of the human eye is much wider than that of a camera. On a sensor/film too much contrast would show up as an over-exposed (featureless, white) region, whereas too little contrast would show up as underexposed (dark) regions.
The eye cannot express movement by instantaneously “freezing” an image of a moving subject, and cannot retain an image”. A camera can do both.
The eye “corrects” for receding parallel lines in the vertical plane, e.g. tall buildings, yet considers those in the horizontal plane to be normal. The camera makes no such distinction.
The eye sees everything it focuses on in the context of its surroundings, relating the part to the whole. A photograph nearly always shows the subject out of context, cut off from the surrounding visuals – a small limited view.
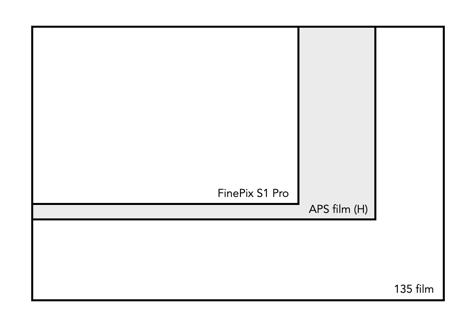
The Fujifilm FinePix S1 Pro was a somewhat strange, yet innovative camera. Released in January 2000, it sported a 1.1 inch Super CCD sensor (23.3×15.6mm) producing 3.4 physical MP, but after processing would produce an image with a resolution of 3040×2016 pixels (6MP). But it wasn’t exactly built from the ground up. It was a mash-up of a Nikon N60 film camera body, and Fujifilm electronics. At this stage it was considered a “digital SLR”, because true 35mm DSLR had yet to appear. It used Nikon lenses, sporting an Nikon-F mount. It’s actually a bit weird discussing a digital camera, but at 22 years old, these early digital cameras are likely in the realm of vintage.
The photosites on the sensor took the form of a honeycomb tessellation, oriented in a zig-zag pattern rather than the traditional row/column array. This resulted in the distance between cells being smaller allowing for more photosites than a regular Bayer sensor. The camera then processed the data to produce the equivalent of a 6.2 MP Bayer sensor. A conventional CCD has rectangular photosites arranged in columns and rows. The SuperCCD has octagonal photosites in a honeycomb configuration. By rotating the photosites 45° to form this interwoven layout, the CCD’s photosite pitch in the horizontal and vertical directions is narrower than in the diagonal direction. This provides a larger relative area of the photosites per total size of the CCD than possible with the conventional CCD structure. In high resolution mode, virtual pixels are created within the spatially interleaved real pixels.
Sensor size
Super CCD photosites (physical and virtual pixels)
In comparison to other cameras of 2000, the Canon EOS D30, Canon’s first “home grown” digital SLR produced 3.1 MP, and Nikon’s D1 (1999) produced 2.7MP. The Super CCD sensor evolved through a succession of designs and cameras until the final 12MP SuperCCD EXR sensor in 2010. The FinePix Pro series continued until the S5 finished production in 2009, still using the Nikon-F mount.
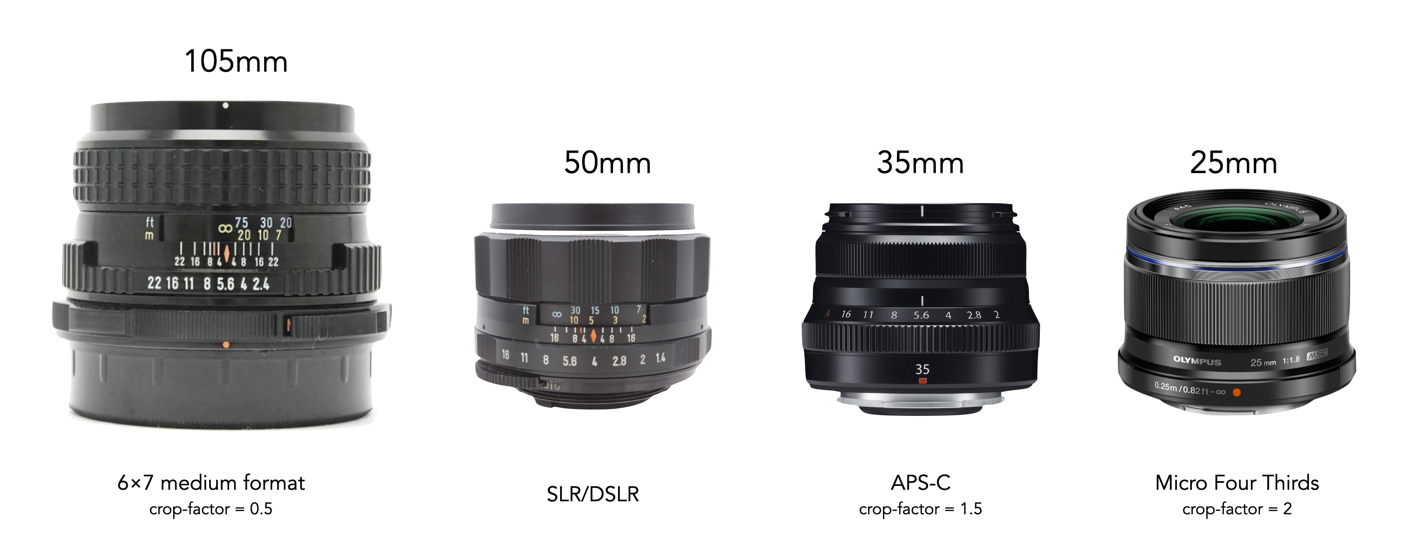
A “normal lens” for a 35mm camera, either film or digital generally refers to a lens with a focal length of 50mm. When you look through the viewfinder of a camera with a 50mm lens attached, the scene looks about the same as it does with the naked eye. Although a 50mm focal length is considered to be a normal lens for a 35mm film or DSLR camera, the same could not be said for all other formats. That’s why you don’t see a lot of 50mm lenses for Micro-Four-Thirds (MFT). A 50mm lens on MFT behaves likes a 100mm full-frame lens, because of the crop-factor, or basically because the sensor size is smaller. Of course “normal” lenses on a 35mm format camera are not exactly pigeonholed into a single focal length, instead they range anywhere from 40mm to 60mm (although this too may differ slightly depends on who describes it).
The standard idea has always been that the focal length of a normal lens should be about the same as that of the diagonal of the film frame/sensor, i.e. the measured distance from one corner of a negative’s frame to the corner diagonally opposite, in millimetres. For example the diagonal of a 36×24mm full-frame is 43mm (although most SLR cameras use a 50mm lanes as “normal”). Even other formats don’t hold true to this mathematical idea. The Olympus PEN F, half-frame camera should have a standard lens of 30mm, however the three lenses offered are instead the 38, 40, and 42mm, equivalent to 55/58/60mm (on a 35mm camera) respectively (there were also 25mm lenses, but they were considered wide angle).
Every different sized sensor has it’s own “normal” lens. Here is a list of normal focal lengths (FL) for various film/sensor sizes (D=digital; F=film), based on commonly used lenses for each system: