Don’t believe the hype: a smartphone will never completely replace a traditional camera.
There is no doubt that smartphones have closed the gap on image quality, and they are popular for their convenience and ease-of-use. But they are not the same as digital cameras. Photography is a craft – it’s not just about capturing reality, which smartphones do really well. It’s about telling stories, and to do that you need some level of creative freedom, which is only available with a versatile camera. Cameras are ergonomically designed for taking photographs, that is their only job.
Cameras are a ubiquitous tool now, as everyone has one in the guise of a smartphone. In 2022 some 1.5 trillion photographs were taken, of which up to 90% originated from smartphones. The quality of the images produced by smartphone cameras is really very good, and why shouldn’t they be, as there is a crazy amount of technology that is incorporated into them. Smartphones of course have many functions, although I am increasingly convinced that their major roles are as a camera, a visual social media device, and a communications device that involves using the phone, or texting. I use mine as a translator with the Google Translate app because it conveniently takes a snapshot of the text I want to translate, and provides me with a quite accurate rendition of the text in English – useful because of the camera. A smartphone is inherently convenient, because it has a small form factor, and is convenient to travel with, allowing us to take pictures of whatever we want. It almost turns the phone into a form of visual record. Then of course there is social media like Instagram, which we use to take photos of things we like to share, like food. Where would we be without the smartphone camera?
However there are natural limits to the effectiveness of a smartphone camera. The first caveat is that while a smartphone is a jack-of-all-trades, a camera is dedicated to just one task – taking pictures. A camera is not a GPS, nor a social media device, nor a music player. But let’s look at some of the core issues. Smartphone cameras are small. As much as that plays as a strength to their overall usefulness, it is a deficit when it comes to being a platform for photography. There is only so much space in a smartphone, and the quality of the images produced is truly magical considering these constraints. The sensors are small, and are therefore limited in their versatility. Photography is all about light, and the more light that can be captured the better. To make up for their compactness, smartphones rely on software to improve the image quality of pictures that are captured.
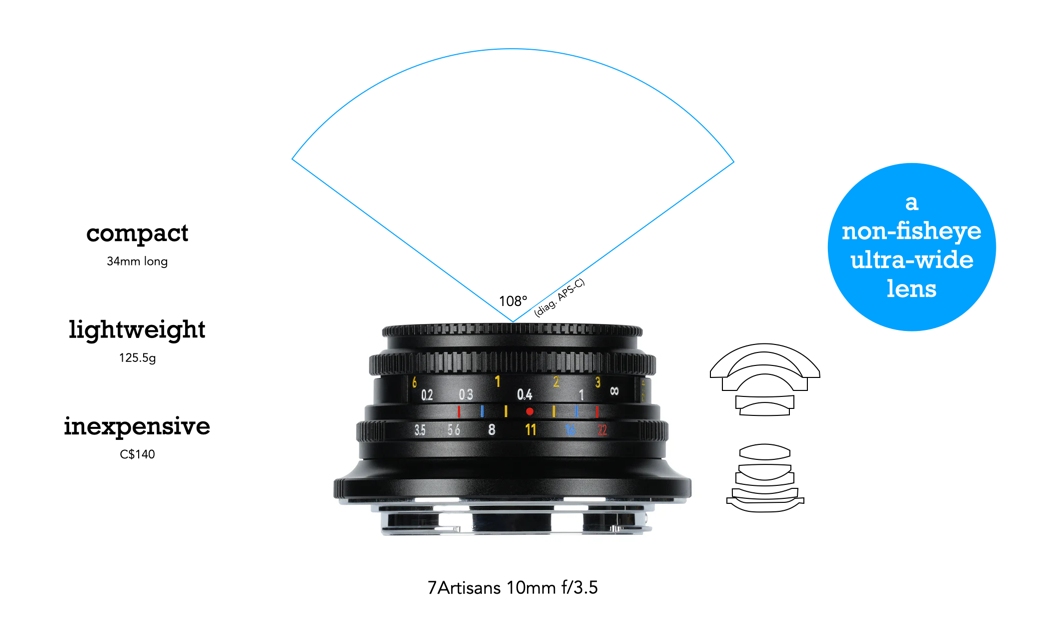
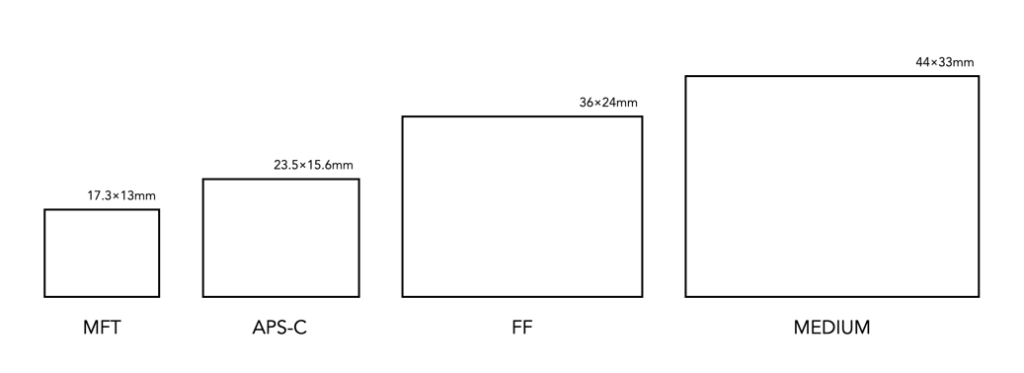
The biggest elephant in the room with smartphone cameras may be image resolution. Most smartphones have restrained the megapixel count to around 12. The iPhone 14 Pro has a 48MP quad-sensor main camera, which seems quite spectacular, but in actuality the sensor defaults to 12MP – the quad-pixel sensor combines every four pixels into one large quad pixel. To create 48MP images ProRAW mode has to be activated, but the images produced are anywhere from 75-100MB in size. The 1/1.28” sensor is 10×7.5mm in size, giving it a crop-factor of 3.46. The crop-factor of APS-C is only 1.5 in comparison. Of course comparing a smartphone camera to a full-frame at the opposite end of the spectrum is hardly fair, they are really designed for different types of photographers.
There are situations where smartphone cameras perform extremely well, and there are others where they don’t. Convenience may be the key factor to their popularity. There is no need to worry about a memory card, and you always have a camera on you. But dig a little deeper, and for the photographer there are some issues. Foremost is the lens itself. It’s compact, small, has a fixed focal length, and usually made of plastic. They are usually good lenses, and continuously evolving, but you can never replicate the same quality as in a larger format camera lens – it just isn’t possible. Then how do smartphones produce images as good as those from full-frame cameras? The reason for the exceptional quality of photos from smartphones is the amalgam of post-processing that is achieved using fancy algorithms. Instagram filters are simple in comparison. Smartphone photo apps are full of “intelligent” computational photography algorithms capable of overcoming the limitations of small sensors and lenses. For example artifacts like geometric distortion, and vignetting, can be easily corrected in-situ. There are even high-end noise reduction algorithms to deal with the fact that smartphones contain small sensors with small photosites.
Then there are the physical things you can do with a camera, even a compact, that just aren’t possible with a smartphone. Case in point, focusing. I know most people never think twice about this because smartphone cameras auto-focus, but what if you don’t want that, what if you want to wrestle some control back? It’s hard. Even with apps like Halide, it isn’t exactly a trivial experience. Part of that has to do with the lack of tactile physical controls. It just isn’t the same trying to control some parameters using a touch-screen interface. There are other neat features on phones, to correct for various artifacts, or add artifacts, but it isn’t exactly easy trying to edit a photograph on a small screen. It’s hard to do things like play with DOF, or heaven forbid bokeh – the device just isn’t set up for that. I find phone cameras great for Instagram, or in situations where I need to copy a document – those apps are awesome. But otherwise, there is just something lacking. Smartphones cameras offer a record of events, places, and things. You can use them to take photos in places where cameras are shunned. In many ways they have created disposable images.
There are a myriad of articles pertaining to the death of cameras, but for true photographers, smartphone cameras will never be a replacement. The basic truth underpinning this is that regardless of the technology, smartphone cameras are limited by their form factor. Yes, smartphone cameras have high resolution, even 12MP is still impressive, but there are more components to the aesthetics of a photograph than just resolution. Even with some manufacturers breaking into uber-pixel smartphone camera, for example the Samsung Galaxy S23 Ultra can take 200MP images, but in reality these are often just more marketing hype than anything else. Yes, you can take a 200MP image, however perhaps not in low-light situations.
Now smartphone cameras can’t replace traditional cameras, but they can help augment your photography. I love my smartphone for the convenience it offers me, 12 megapixels, portability, basic in-app image processing, Instagram, and even being able to translate documents. Smartphones have completely automated photography, but one has to question what happened to the aesthetics of taking photographs? For photography is not just about recording events, it is about capturing a moment in time in such a way that it is memorable.