Viewing distances, DPI and image size for printing

When it comes to megapixels, the bottom line might be how an image ends up being used. If viewed on a digital device, be it an ultra-resolution monitor or TV, there are limits to what you can see. To view an image on an 8K TV at full resolution, we would need a 33MP image. However any device smaller than this will happily work with a 24MP image, and still not display all the pixels. Printing is however another matter all together.

The standard for quality in printing is 300dpi, or 300 dots-per-inch. If we equate a pixel to a dot, then we can work out the maximum size an image can be printed. 300 dpi is generally the “standard”, because that is the resolution most commonly used. To put this into perspective, at 300dpi, or 300 dots per 25.4mm, each pixel printed on a medium would be 0.085mm, or about as thick as 105 GSM weight paper. That means a dot area of roughly 0.007mm². For example a 24MP image containing 6000×4000 pixels can be printed to a maximum size of 13.3×20 inches (33.8×50.8cm) at 300dpi. The print sizes for a number of different sized images printed using 300dpi are shown in Figure 1.

Fig.1: Maximum printing sizes for various image sizes at 300dpi

The thing is that you may not even need 300dpi? At 300dpi the minimum viewing distance is theoretically 11.46”, whereas dropping it down to 180dpi means the viewing distance increases to 19.1” (but the printed size of an image can increase). In the previous post we discussed visual acuity in terms of the math behind it. Knowing that a print will be viewed from a minimum of 30” away allows us to determine that the optimal DPI required is 115. Now if we have a large panoramic print, say 80″ wide, printed at 300dpi, then the calculated minimum viewing distance is ca. 12″ – but it is impossible to view the entire print being only one foot away from it. So how do we calculate the optimal viewing distance, and then use this to calculate the actual number of DPI required?

The amount of megapixels required of a print can be guided in part by the viewing distance, i.e. the distance from the centre of the print to the eyes of the viewer. The golden standard for calculating the optimal viewing distance involves the following process:

  • Calculate the diagonal of the print size required.
  • Multiply the diagonal by 1.5 to calculate the minimum viewing distance
  • Multiply the diagonal by 2.0 to calculate the maximum viewing distance.

For example a print which is 20×30″ will have a diagonal of 36″, so the optimal viewing distance range from minimum to maximum is 54-72 inches (137-182cm). This means that we are no longer reliant on the use of 300dpi for printing. Now we can use the equations set out in the previous post to calculate the minimum DPI for a viewing distance. For the example above, the minimum DPI required is only 3438/54=64dpi. This would imply that the image size required to create the print is (20*64)×(30*64) = 2.5MP. Figure 2 shows a series of sample print sizes, viewing distances, and minimum DPI (calculated using dpi=3438/min_dist).

Fig.2: Viewing distances and minimum DPI for various common print sizes

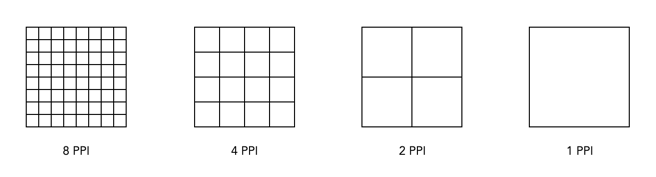
Now printing at such a low resolution likely has more limitations than benefits, for example there is no guarantee that people will view the panorama from a set distance. So there likely is a lower bound to the practical amount of DPI required, probably around 180-200dpi because nobody wants to see pixels. For the 20×30″ print, boosting the DPI to 200 would only require a modest 24MP image, whereas a full 300dpi print would require a staggering 54MP image! Figure 3 simulates a 1×1″ square representing various DPI configurations as they might be seen on a print. Note that even at 120dpi the pixels are visible – the lower the DPI, the greater the chance of “blocky” features when view up close.

Fig.3: Various DPI as printed in a 1×1″ square

Are the viewing distances realistic? As an example consider the viewing of a 36×12″ panorama. The diagonal for this print would be 37.9″, so the minimum distance would be calculated as 57 inches. This example is illustrated in Figure 4. Now if we work out the actual viewing angle this creates, it is 37.4°, which is pretty close to 40°. Why is this important? Well THX recommends that the “best seat-to-screen distance” (for a digital theatre) is one where the view angle approximates 40 degrees, and it’s probably not much different for pictures hanging on a wall. The minimum resolution for the panoramic print viewed at this distance would be about 60dpi, but it can be printed at 240dpi with an input image size of about 25MP.

Fig.4: An example of viewing a 36×12″ panorama

So choosing a printing resolution (DPI) is really a balance between: (i) the number of megapixels an image has, (ii) the size of the print required, and (iii) the distance a print will be viewed from. For example, a 24MP image printed at 300dpi will allow a maximum print size of 13.3×20 inches, which has an optimal viewing distance of 3 feet, however by reducing the DPI to 200, we get an increased print size of 20×30 inches, with an optimal viewing distance of 4.5 feet. It is an interplay of many differing factors, including where the print is to be viewed.

P.S. For small prints, such as 5×7 and 4×6, 300dpi is still the best.

P.P.S. For those who who can’t remember how to calculate the diagonal, it’s using the Pythagorean Theorem. So for a 20×30″ print, this would mean:

diagonal = √(20²+30²)
         = √1300
         = 36.06

PPI vs. DPI: what is the difference?

Image resolution for devices is commonly expressed in one of two forms: PPI or DPI. Two terms that are both similar and different. Both relate to pixel density in different mediums, and although many use them interchangeably, there are differences between the two. Neither one has any direct relation to the content of an image, because regardless of how it is acquired, images are made of pixels, which are dimensionless. Both relate to how an image is either viewed on screen, or printed.

PPI

PPI stands for pixels-per-inch, and is the pixel density associated with digital devices typically used to view images. PPI only becomes useful when an image is brought into the real world, for example displaying it on a screen. It refers to the number of pixels that a device (e.g. screen) can display within one inch of space. For example the iMac Pro has 5120×2880 pixels in its display, and its pixel density is 218ppi. The 6.1″ iPhone 12 has a 2532×1170 display with 460ppi. The higher the value for PPI, the greater the pixel density, and the smaller the size of the pixels. Images shown on devices with higher dpi often appear sharper than those displayed on low resolution devices. However this is also dependent on your distance to the device, and the how good your eyes are. The examples in Fig.1 show examples of various pixel densities.

Fig.1: Various pixel densities

To illustrate how PPI of a device affects the display of an image, consider the example shown in Fig.2. A 280×280 image has been shown simulated on four devices with differing values of PPI: 210, 280, 140, and 70. Higher pixel densities makes the image look sharper – for example at 280ppi, the entire image fits into the 1″×1″ region on the screen. At 70ppi it takes 4″×4″=16in2 to display the same image, which means a much lower resolution where parts of the image may start to look “blocky” and edges appear jagged.

Fig.2: An example of a 280×280 image shown on devices with differing PPI.

Different sized devices, can have the same resolution, but differing pixel densities. For example consider a series of televisions with 55″, 60″, and 65″ displays. The display resolution for each of these TV’s is the same, at 3840×2160 pixels. The 55″ TV will have 80ppi, the 60″ 73ppi, and the 65″ 68ppi. All have differing PPI because although the number of pixels is the same, the size of the pixels on each device is slightly different. To determine the size of an image on a particular screen, take the dimensions of the image and divide those values by the resolution of the screen. For example, an image that is 3000×2000 pixels in size shown on a device that has a resolution of 218ppi will display as 3000/218=13.76″ wide, and 2000/218=9.17″ high.

DPI

DPI implies dots-per-inch, and refers to the resolution value of a physical printing (or scanning) device. Printers reproduce an image by spraying out tiny dots, and the number of dots per inch affects the amount of detail and overall quality of a print. Figure 3 shows the 280×280 image printed out on three devices, one with 280dpi, one with 560dpi, and a third with 140dpi. The lower DPI results in a larger, if somewhat coarser, image. In all cases, the ratio of dot to pixel is 1:1, it’s just the size of the dots that changes. In the first case, 280dpi means that each dot is 1/280″ in size, and the image is printed in an area of 1″×1″. In the second case, the size of each dot is 1/560″, so the image printed in a space of ½”×½”. In the final case, the size of each dot is 1/140″, so the image printed in an area of 2″×2″.

Fig.3: The effect of DPI on printing.

The trick with DPI is how many dots can be packed into an inch? An inkjet printer can produce a resolution of between 720-2880dpi, whereas a laser printer produced images between 600-2400dpi. Theoretically the more dots, the crisper the image, but 300 DPI is already packing 90,000 dots on colour in a square inch, so how much better 1200dpi is, is likely debatable.

Sometimes, the metadata for an image will include the DPI, e.g. DPI=72. This makes no difference to the how an image is viewed on a screen, nor does it impact the size of the image file. Three different copies of the same file can have DPI values of 72, 150, and 300. All three will have the same number of pixels, and the same file size. Only when they are printed out will they appear as different sizes.

DPI and scanning

DPI also relates to scanning. The larger the DPI set on a scan, the more detail the image will contain, however there are limits with respect to the quality of the scanner, and the quality of the image. For example, a 5″×7″ photographed scanned at 150dpi will result in an image of size 750×1050 pixels in size, whereas if it were scanned at 300dpi, the resulting image would be 1500×2100 pixels.

What about LPI?

There is of course a third measure, LPI, or lines-per-inch, which is used in offset printing. This is used to measure resolution in images that are converted into a pattern of dots – halftones. Standard newspapers are printed at 85lpi, and offset-presses are 130-150lpi.

The 72dpi Myth

There is still a lot of talk about the magical 72dpi. This harkens back to the time decades ago when computer screens commonly had 72ppi (the Macintosh 128K had a 512×342 pixel display), as opposed to the denser screens we have now. This had to do with Apple’s attempt to match the size of the text on the screen to the size when it is printed, known as WYSIWYG (What-You-See-Is-What-You-Get). Apple basically matching the 128K to their dot matrix printer, the “ImageWriter”.

Dots and printers

There are different types of printers where dots are perceived a little differently. For example a colour inkjet printer can only create droplets of a few different colours for each dot, so small dots are combined to simulate continuous colour. Modern inkjet printers have high resolutions like 2400×1200, or 2880×1440. A dye-sublimation colour printer on the other hand produce continuous tone colour, meaning that every “dot” in an image can be an arbitrary colour (although there aren’t really any dots). Dye-sub printers normally have a resolution of between 300-500dpi. Many inkjet printers have resolutions like 2880×1440dpi, however this usually describes how many droplets of ink are placed in the 1in2 area, considering many are overlaid to create various colours.