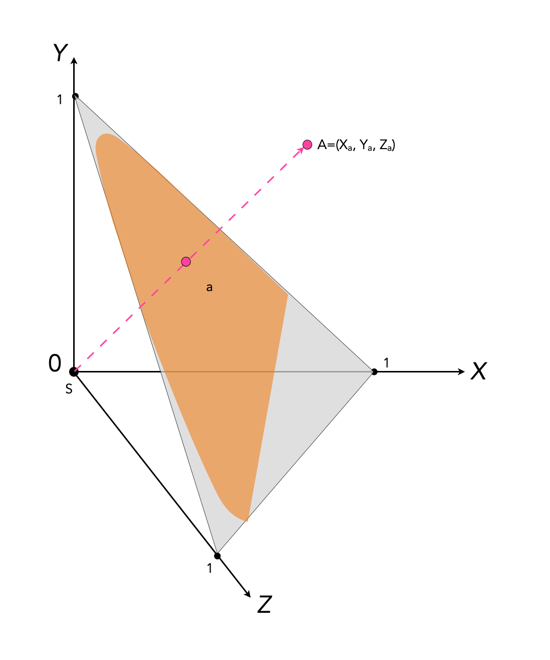
Colour can be divided up into luminosity and chromaticity. The CIE XYZ colour space was designed such that Y is a measure of the luminance of a colour. Consider a 3D plane is described by X=Y=Z=1, as shown in Figure 1. A colour point A=(Xa,Ya,Za) is then found by intersecting the line SA (S=starting point, X=Y=Z=0) with the plane formed within the CIE XYZ colour volume. As it is difficult to perceive 3D spaces, most chromaticity diagrams discard luminance and show the maximum extent of the chromaticity of a particular 2D colour space. This is achieved by dropping the Z component, and projecting back onto the XY plane.
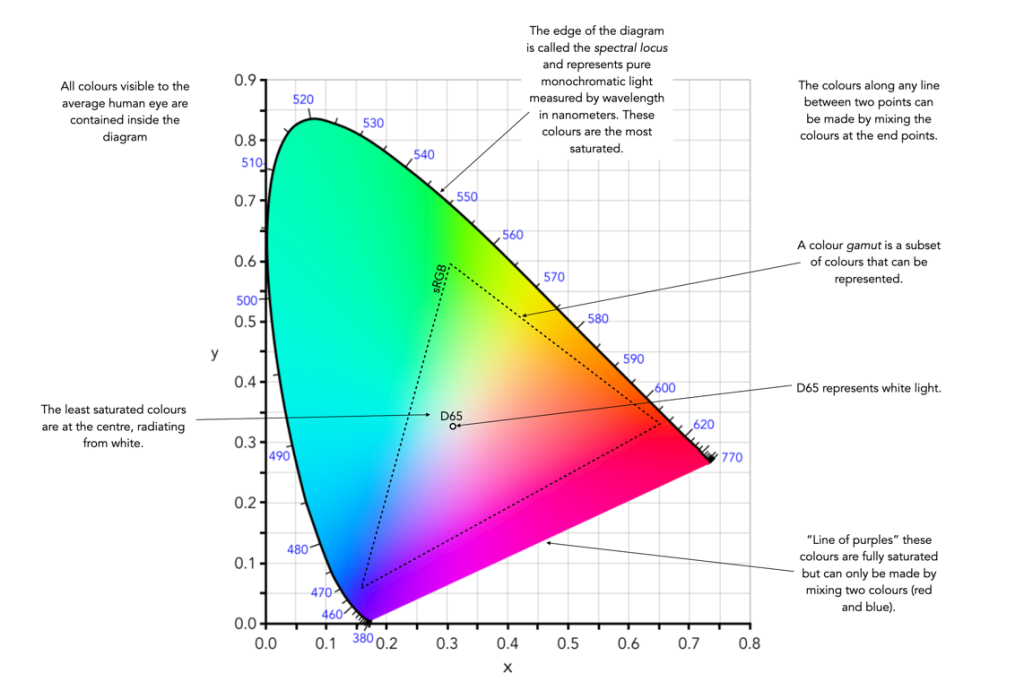
This diagram shows all the hues perceivable by the standard observer for various (x, y) pairs, and indicates the spectral wavelengths of the dominant single frequency colours. When Y is plotted against X for spectrum colours, it forms a horseshoe, or shark-fin, shaped diagram commonly referred to as the CIE chromaticity diagram where any (x,y) point defines the hue and saturation of a particular colour.
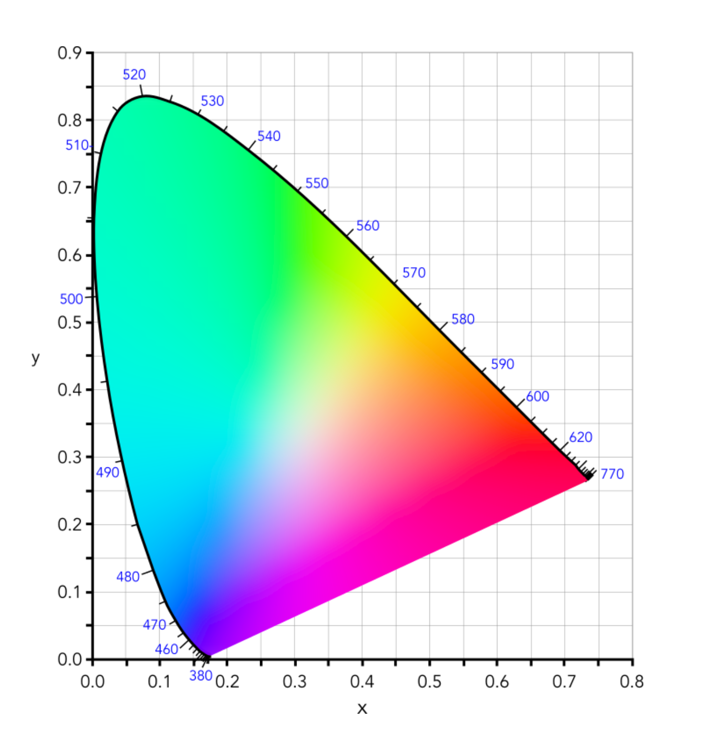
The xy values along the curved boundary of the horseshoe correspond to the “spectrally pure”, fully saturated colours with wavelengths ranging from 360nm (purple) to 780nm (red). The area within this region contains all the colours that can be generated with respect to the primary colours on the boundary. The closer a colour is to the boundary, the more saturated it is, with saturation reducing towards the “neutral point” in the centre of the diagram. The two extremes, violet (360nm) and red (780nm) are connected with an imaginary line. This represents the purple hues (combinations of red and blue) that do not correspond to primary colours. The “neutral point” at the centre of the horseshoe (x=y=0.33) has zero saturation, and is typically marked as D65, and corresponds to a colour temperature of 6500K.